
This historic brick Studebaker Building, originally built in 1925, was chosen as the location for the USGS St. Petersburg Coastal and Marine Science Center in the late 1980s.
Images
Coastal and Marine Hazards and Resources Program images.
Filter Total Items: 2420

USGS St. Petersburg Studebaker Building
This historic brick Studebaker Building, originally built in 1925, was chosen as the location for the USGS St. Petersburg Coastal and Marine Science Center in the late 1980s.

Provincetown, MA
This image was created using the Continuous Bathymetry and Elevation Models of the Massachusetts Coastal Zone and Continental Shelf, shows Provincetown, MA and the northern section of the Cape Cod National Seashore.
This image was created using the Continuous Bathymetry and Elevation Models of the Massachusetts Coastal Zone and Continental Shelf, shows Provincetown, MA and the northern section of the Cape Cod National Seashore.

Guam and CNMI Coral Reefs and Coastal Hazard Risk Reduction
Guam and CNMI Coral Reefs and Coastal Hazard Risk ReductionRigorously Valuing the Role of Guam’s Coral Reefs and the Commonwealth of the Northern Mariana Islands’s Coral Reefs in Coastal Hazard Risk Reduction
Estimated Annual Benefits
Guam and CNMI Coral Reefs and Coastal Hazard Risk Reduction
Guam and CNMI Coral Reefs and Coastal Hazard Risk ReductionRigorously Valuing the Role of Guam’s Coral Reefs and the Commonwealth of the Northern Mariana Islands’s Coral Reefs in Coastal Hazard Risk Reduction
Estimated Annual Benefits

American Samoa Coral Reefs and Coastal Hazard Risk Reduction
American Samoa Coral Reefs and Coastal Hazard Risk ReductionRigorously Valuing the Role of American Samoa’s Coral Reefs in Coastal Hazard Risk Reduction
Estimated Annual Benefits
American Samoa Coral Reefs and Coastal Hazard Risk Reduction
American Samoa Coral Reefs and Coastal Hazard Risk ReductionRigorously Valuing the Role of American Samoa’s Coral Reefs in Coastal Hazard Risk Reduction
Estimated Annual Benefits

U.S. Virgin Islands Coral Reefs and Coastal Hazard Risk Reduction
U.S. Virgin Islands Coral Reefs and Coastal Hazard Risk ReductionRigorously Valuing the Role of the U.S. Virgin Islands’ Coral Reefs in Coastal Hazard Risk Reduction
Estimated Annual Benefits
U.S. Virgin Islands Coral Reefs and Coastal Hazard Risk Reduction
U.S. Virgin Islands Coral Reefs and Coastal Hazard Risk ReductionRigorously Valuing the Role of the U.S. Virgin Islands’ Coral Reefs in Coastal Hazard Risk Reduction
Estimated Annual Benefits

Cliff Feature Delineation Tool Outputs in Malibu, California
Cliff Feature Delineation Tool Outputs in Malibu, CaliforniaDigital three-dimensional rendering of the coastal cliffs around Point Dume in Malibu, California. Cliff feature outputs from the Cliff Feature Delineation Tool are shown to conceptually display the cliff delineation process, including cross-shore transects (green), the cliff top line (red), the cliff toe line (blue), and subsidiary cliff features (orange).

Florida Coral Reefs and Coastal Hazard Risk Reduction
Florida Coral Reefs and Coastal Hazard Risk ReductionRigorously Valuing the Role of Florida’s Coral Reefs in Coastal Hazard Risk Reduction
Estimated Annual Benefits
Florida Coral Reefs and Coastal Hazard Risk Reduction
Florida Coral Reefs and Coastal Hazard Risk ReductionRigorously Valuing the Role of Florida’s Coral Reefs in Coastal Hazard Risk Reduction
Estimated Annual Benefits

Hawaiʻi Coral Reefs and Coastal Hazard Risk Reduction
Hawaiʻi Coral Reefs and Coastal Hazard Risk ReductionRigorously Valuing the Role of Hawaiʻi’s Coral Reefs in Coastal Hazard Risk Reduction
Estimated Annual Benefits
Hawaiʻi Coral Reefs and Coastal Hazard Risk Reduction
Hawaiʻi Coral Reefs and Coastal Hazard Risk ReductionRigorously Valuing the Role of Hawaiʻi’s Coral Reefs in Coastal Hazard Risk Reduction
Estimated Annual Benefits

Puerto Rico Coral Reefs and Coastal Hazard Risk Reduction
Puerto Rico Coral Reefs and Coastal Hazard Risk ReductionRigorously Valuing the Role of Puerto Rico’s Coral Reefs in Coastal Hazard Risk Reduction
Estimated Annual Benefits
Puerto Rico Coral Reefs and Coastal Hazard Risk Reduction
Puerto Rico Coral Reefs and Coastal Hazard Risk ReductionRigorously Valuing the Role of Puerto Rico’s Coral Reefs in Coastal Hazard Risk Reduction
Estimated Annual Benefits

Economic benefit of coral reef-lined coastlines in U.S.
Economic benefit of coral reef-lined coastlines in U.S.Map displaying the distribution of total economic losses (direct building damages and indirect economic disruption) in the U.S. that are prevented from flooding by coral reefs annually. In total, the annual coastal flooding risk reduction benefits provided by U.S. coral reefs exceed \$1.8 billion.

The Coastal Change Hazards program engages with stakeholders
The Coastal Change Hazards program engages with stakeholdersThe Coastal Change Hazard (CCH) program’s Stakeholder Engagement and Communication (SEC) component is focused on connecting CCH science to stakeholders to learn more about their needs for data, tools, and information.

Evolution of shoreline around Elwha River mouth
Evolution of the shoreline around the Elwha River mouth, Washington, before, during and after dam removal, 2011–2017. Two large dams were removed from the Elwha River between 2011 and 2014 in the largest dam removal worldwide thus far, releasing more than 20 million tons of sediment downstream.
Evolution of the shoreline around the Elwha River mouth, Washington, before, during and after dam removal, 2011–2017. Two large dams were removed from the Elwha River between 2011 and 2014 in the largest dam removal worldwide thus far, releasing more than 20 million tons of sediment downstream.

Modern coral reef dominated by weedy coral species
Modern coral reef dominated by weedy coral speciesA coral reef in the Turks and Caicos Islands dominated by the weedy coral species, Porites astreoides. The relative dominance of this taxa has increased throughout the western Atlantic.
Modern coral reef dominated by weedy coral species
Modern coral reef dominated by weedy coral speciesA coral reef in the Turks and Caicos Islands dominated by the weedy coral species, Porites astreoides. The relative dominance of this taxa has increased throughout the western Atlantic.

SuBastian’s manipulator jaw stabilizes GEOMAR’s glowing bubble box
SuBastian’s manipulator jaw stabilizes GEOMAR’s glowing bubble boxROV SuBastian’s manipulator jaw stabilizes GEOMAR’s glowing bubble box that is capturing high-resolution images of methane bubbles rising from the seafloor.
SuBastian’s manipulator jaw stabilizes GEOMAR’s glowing bubble box
SuBastian’s manipulator jaw stabilizes GEOMAR’s glowing bubble boxROV SuBastian’s manipulator jaw stabilizes GEOMAR’s glowing bubble box that is capturing high-resolution images of methane bubbles rising from the seafloor.

Retrieving a core sampler
USGS scientists Dan Powers (left) and Andy Ritchie retrieving a core sample from beneath Lake Ozette aboard research vessel Hadai.
USGS scientists Dan Powers (left) and Andy Ritchie retrieving a core sample from beneath Lake Ozette aboard research vessel Hadai.
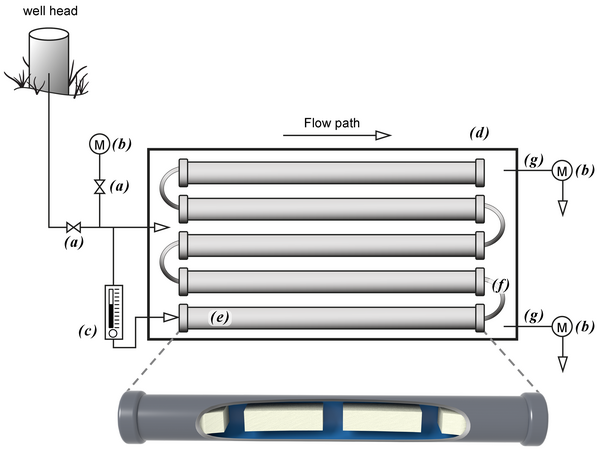
Above ground mesocosm with biofilm growth reactors
Above ground mesocosm with biofilm growth reactorsAbove ground mesocosm with biofilm growth reactors. Groundwater from the well head is directly transferred to the mesocosm via PTFE tubing into a high flow rate control valve (a) that diverts groundwater into a flow cell containing a water quality measurement meter (b) and a low flow control valve (c).

Sediment Samples
Once removed from the pressure core testing tool, this specimen shows that it is not a homogeneous sediment. The mostly fine-grained sample (dark sediment in all three images) easily breaks apart at a thin layer of coarse-grained sediment (light sediment on the inner core surfaces of images (i) and (ii).
Once removed from the pressure core testing tool, this specimen shows that it is not a homogeneous sediment. The mostly fine-grained sample (dark sediment in all three images) easily breaks apart at a thin layer of coarse-grained sediment (light sediment on the inner core surfaces of images (i) and (ii).

GPS in the Phragmites
USGS technician Jennifer O’Keefe Suttles stands within a Phragmites stand within the Herring River Estuary, part of the Cape Cod National Seashore.
USGS technician Jennifer O’Keefe Suttles stands within a Phragmites stand within the Herring River Estuary, part of the Cape Cod National Seashore.

UNC mini landers surrounded by Sablefish
Two UNC mini landers, surrounded by Sablefish (Anoplopoma fimbria) and pink sea urchins, incubate seawater in situ to enable calculations of methane oxidation rates.
Two UNC mini landers, surrounded by Sablefish (Anoplopoma fimbria) and pink sea urchins, incubate seawater in situ to enable calculations of methane oxidation rates.

Red plumes burst out from the tops of these chemosynthetic tubeworms
Red plumes burst out from the tops of these chemosynthetic tubewormsRed plumes burst out from the tops of these chemosynthetic tubeworms, capturing hydrogen sulfide and oxygen from the surrounding water to feed their bacterial endosymbionts. The tubeworm tubes provide a habitat for several benthic animals, including the pale pink branching octocorals seen here

A photo of a National Park Service information plate
A photo of a National Park Service information plateA photo of a National Park Service information plate on “Sharks in Cape Cod Waters”, Cape Cod, MA, taken during a field study reconnaissance mission.
A photo of a National Park Service information plate
A photo of a National Park Service information plateA photo of a National Park Service information plate on “Sharks in Cape Cod Waters”, Cape Cod, MA, taken during a field study reconnaissance mission.