
Jessica Rodysill (Reston) and Hunter Wilcox (SPCMSC) deploying a corer in Lake Enriquillo. The scientists will use the cores to construct precipitation changes in Dominican Republic over the late Holocene (~5000 years ago to present) time period.
Images
Coastal and Marine Hazards and Resources Program images.
Filter Total Items: 2420

Researchers deploying a corer in Lake Enriquillo.
Jessica Rodysill (Reston) and Hunter Wilcox (SPCMSC) deploying a corer in Lake Enriquillo. The scientists will use the cores to construct precipitation changes in Dominican Republic over the late Holocene (~5000 years ago to present) time period.

Researchers collect measurements of reef erosion
Lauren Toth (Research Physical Scientist, SPCMSC) and collaborator Mike Colella (Florida Fish and Wildlife Conservation Commission) collect measurements of reef erosion at Molasses reef off Key Largo, FL.
Lauren Toth (Research Physical Scientist, SPCMSC) and collaborator Mike Colella (Florida Fish and Wildlife Conservation Commission) collect measurements of reef erosion at Molasses reef off Key Largo, FL.

SPMSC scientist Lauren Toth conducts a photographic survey of the reef
SPMSC scientist Lauren Toth conducts a photographic survey of the reefSPMSC scientist Lauren Toth conducts a photographic survey of Porter Patch reef off Key Largo, one of the sites that has been surveyed as part of FWRI’s Coral Reef Ecosystem Monitoring project since 1996.
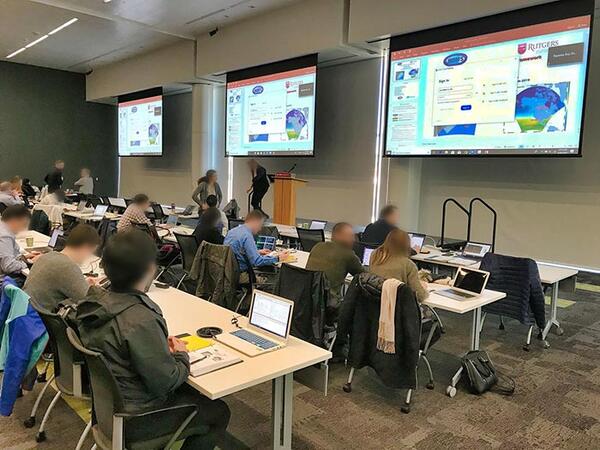
COAWST model training room
COAWST model training room.

Low-altitude aerial photograph of Plum Island, Massachusetts
Low-altitude aerial photograph of Plum Island, MassachusettsLow-altitude aerial photograph of Plum Island, Massachusetts, , from USGS field activity 2019-009-FA.
Low-altitude aerial photograph of Plum Island, Massachusetts
Low-altitude aerial photograph of Plum Island, MassachusettsLow-altitude aerial photograph of Plum Island, Massachusetts, , from USGS field activity 2019-009-FA.

Giving a Tour of USGS Science Center
On March 25th, 2019, ocean engineer Rob Wyland of the Pacific Coastal and Marine Science Center gave a tour and demonstration to roughly a dozen students from the engineering class he teaches at Cabrillo College, a local community college.
On March 25th, 2019, ocean engineer Rob Wyland of the Pacific Coastal and Marine Science Center gave a tour and demonstration to roughly a dozen students from the engineering class he teaches at Cabrillo College, a local community college.

Mud Creek landslide flight path example
USGS photographs taken from a contracted small airplane are used to build three-dimensional representations of the hillslopes of Big Sur, California, as shown here for the Mud Creek landslide site in 2017. Blue symbols show the locations of individual photos obtained on the flight, and the gray area shows the hillslope landscape created from the photos using S
USGS photographs taken from a contracted small airplane are used to build three-dimensional representations of the hillslopes of Big Sur, California, as shown here for the Mud Creek landslide site in 2017. Blue symbols show the locations of individual photos obtained on the flight, and the gray area shows the hillslope landscape created from the photos using S

Changes to Mud Creek digital surface models
Computer images showing the coastal cliff area of Mud Creek on the Big Sur coastline, central California, where on May 20, 2017 a catastrophic landslide destroyed over 400 meters of scenic California State Highway 1. These illustrations show the changes to the digital surface models of Mud Creek during the three primary phases of the landslide: (
Computer images showing the coastal cliff area of Mud Creek on the Big Sur coastline, central California, where on May 20, 2017 a catastrophic landslide destroyed over 400 meters of scenic California State Highway 1. These illustrations show the changes to the digital surface models of Mud Creek during the three primary phases of the landslide: (

USGS pilot landing an unmanned aerial system on Dauphin Island, AL
USGS pilot landing an unmanned aerial system on Dauphin Island, ALUSGS unmanned aerial system (drone) pilot collecting aerial imagery and ground control points for the Coastal Resource Evaulation for Management Applications (CREMA) project on Dauphin Island, Alabama

Orthophotomosaic image, north coast of Barter Island, July 1, 2014
Orthophotomosaic image, north coast of Barter Island, July 1, 2014Aerial photographs were collected from a small, fixed-wing aircraft over the coast of Barter Island, Alaska on July 01 2014, September 07 2014. Precise aircraft position information and structure-from-motion photogrammetric methods were combined to derive a high-resolution orthophotomosaic.

Surficial Geology Map of Nantucket and Marthas Vineyard, MA
Surficial Geology Map of Nantucket and Marthas Vineyard, MAMap showing the surficial geology from this study and Baldwin and others (2016) with equivalent onshore geology (adapted from Stone and DiGiacomo-Cohen, 2009). The areal extents over which offshore subsurface geologic units crop out at the sea floor were interpreted from seismic-reflection data.

Map of instrument mooring locations, Monterey Canyon
Map of instrument mooring locations, Monterey CanyonMap of locations of instrument moorings where we collected time-series oceanographic data from the Monterey Canyon, offshore of Montery, California, from October 2015 - March 2017
Map of instrument mooring locations, Monterey Canyon
Map of instrument mooring locations, Monterey CanyonMap of locations of instrument moorings where we collected time-series oceanographic data from the Monterey Canyon, offshore of Montery, California, from October 2015 - March 2017

Dann Blackwood and Jon Borden drop a current meter overboard
Dann Blackwood and Jon Borden drop a current meter overboardDann Blackwood and Jon Borden prepare to drop a current meter overboard from the research boat Muddy Waters offshore of Wellfleet, Massachusetts.
Dann Blackwood and Jon Borden drop a current meter overboard
Dann Blackwood and Jon Borden drop a current meter overboardDann Blackwood and Jon Borden prepare to drop a current meter overboard from the research boat Muddy Waters offshore of Wellfleet, Massachusetts.

Bellingham Bay tracklines and eelgrass distributions
Bellingham Bay tracklines and eelgrass distributionsMaps show eelgrass distribution (left) along the tracklines followed by the boat (right).
Bellingham Bay tracklines and eelgrass distributions
Bellingham Bay tracklines and eelgrass distributionsMaps show eelgrass distribution (left) along the tracklines followed by the boat (right).

Hurricane Florence Animation
Animation showing contaminants entering the ocean through the large river discharge following Hurricane Florence (higher concentrations displayed with lighter color).
Animation showing contaminants entering the ocean through the large river discharge following Hurricane Florence (higher concentrations displayed with lighter color).

Amy Gartman waits for an X-ray diffractometer
Amy Gartman waits for an X-ray diffractometer to analyze samples of hydrothermal sulfide minerals.
Amy Gartman waits for an X-ray diffractometer to analyze samples of hydrothermal sulfide minerals.

Mineral-laden water emerging from a hydrothermal vent
Mineral-laden water emerging from a hydrothermal ventMineral-laden water emerging from a hydrothermal vent on the Niua underwater volcano in the Lau Basin, southwest Pacific Ocean. As the water cools, minerals precipitate to form tower-like “chimneys.” Image taken during 2016 cruise “Virtual Vents.”

Seismic Collage
Image showing a collage of examples of multi-channel and single-channel seismic data collected by the USGS, seismic equipment deployed from a research vessel, and seismic equipment on a research vessel. These data are critical to the CMG Program as they define the geology in marine and coastal environments.
Image showing a collage of examples of multi-channel and single-channel seismic data collected by the USGS, seismic equipment deployed from a research vessel, and seismic equipment on a research vessel. These data are critical to the CMG Program as they define the geology in marine and coastal environments.

Piping Plover Habitat, Cedar Island
The beach-dependent shorebirds project at the Woods Hole Coastal and Marine Science Center models current and future habitat availability for nesting shorebirds in an effort to map current and likely future habitat availability on a range of sites along the U.S. Atlantic coast.
The beach-dependent shorebirds project at the Woods Hole Coastal and Marine Science Center models current and future habitat availability for nesting shorebirds in an effort to map current and likely future habitat availability on a range of sites along the U.S. Atlantic coast.

Map of the Martha’s Vineyard and Nantucket study sites outlined in red
Map of the Martha’s Vineyard and Nantucket study sites outlined in redMap of the Martha’s Vineyard and Nantucket study sites outlined in red.
Map of the Martha’s Vineyard and Nantucket study sites outlined in red
Map of the Martha’s Vineyard and Nantucket study sites outlined in redMap of the Martha’s Vineyard and Nantucket study sites outlined in red.

Aerial view of a southeast Louisiana coastal marsh
Aerial view of a southeast Louisiana coastal marshAerial view of a southeast Louisiana coastal marsh.
Aerial view of a southeast Louisiana coastal marsh
Aerial view of a southeast Louisiana coastal marshAerial view of a southeast Louisiana coastal marsh.