
Time-exposure image of Isla Verde in San Juan, Puerto Rico, from a coastal video monitoring station. Image is time-averaged over 10 minutes of video.
Images
Coastal and Marine Hazards and Resources Program images.
Filter Total Items: 2420

Isla Verde Video Camera 3 Timex
Time-exposure image of Isla Verde in San Juan, Puerto Rico, from a coastal video monitoring station. Image is time-averaged over 10 minutes of video.

Isla Verde Video Camera 2 Bright Image
Bright image of Isla Verde in San Juan, Puerto Rico, from a coastal video monitoring station. Image is compiled from 10 minutes of video and tracks the brightest pixels through 10 minutes of motion.
Bright image of Isla Verde in San Juan, Puerto Rico, from a coastal video monitoring station. Image is compiled from 10 minutes of video and tracks the brightest pixels through 10 minutes of motion.

Sunset State Beach variance image
Image from video camera along Sunset State Beach in Watsonville, CA, looking northwest. Every half hour during daylight hours, the camera shoots video for 10 minutes.
Image from video camera along Sunset State Beach in Watsonville, CA, looking northwest. Every half hour during daylight hours, the camera shoots video for 10 minutes.

Instrument check at a tidal creek, Falmouth, MA
Meagan Gonneea checks on instruments at a tidal creek in Great Pond, Falmouth, MA. Daily tides drive exchange between coastal wetlands and adjacent estuaries. Here we have instrumented a tidal channel to measure those fluxes over a tidal cycle. When the marsh floods, material is imported from the estuary.
Meagan Gonneea checks on instruments at a tidal creek in Great Pond, Falmouth, MA. Daily tides drive exchange between coastal wetlands and adjacent estuaries. Here we have instrumented a tidal channel to measure those fluxes over a tidal cycle. When the marsh floods, material is imported from the estuary.

Isla Verde Video Camera 2 Variance Image
Variance image of Isla Verde in San Juan, Puerto Rico, from a coastal video monitoring station. Image is compiled from 10 minutes of video and shows areas of more movement as brighter colors.
Variance image of Isla Verde in San Juan, Puerto Rico, from a coastal video monitoring station. Image is compiled from 10 minutes of video and shows areas of more movement as brighter colors.

Isla Verde Video Camera 3 Dark Image
Dark image of Isla Verde in San Juan, Puerto Rico, from a coastal video monitoring station. Image is compiled from 10 minutes of video and tracks the darkest pixels through 10 minutes of motion.
Dark image of Isla Verde in San Juan, Puerto Rico, from a coastal video monitoring station. Image is compiled from 10 minutes of video and tracks the darkest pixels through 10 minutes of motion.

Isla Verde Video Camera 4 Dark Image
Dark image of Isla Verde in San Juan, Puerto Rico, from a coastal video monitoring station. Image is compiled from 10 minutes of video and tracks the darkest pixels through 10 minutes of motion.
Dark image of Isla Verde in San Juan, Puerto Rico, from a coastal video monitoring station. Image is compiled from 10 minutes of video and tracks the darkest pixels through 10 minutes of motion.

Isla Verde Video Camera 4 Timex
Time-exposure image of Isla Verde in San Juan, Puerto Rico, from a coastal video monitoring station. Image is time-averaged over 10 minutes of video.
Time-exposure image of Isla Verde in San Juan, Puerto Rico, from a coastal video monitoring station. Image is time-averaged over 10 minutes of video.

Isla Verde Video Camera 2 Dark Image
Dark image of Isla Verde in San Juan, Puerto Rico, from a coastal video monitoring station. Image is compiled from 10 minutes of video and tracks the darkest pixels through 10 minutes of motion.
Dark image of Isla Verde in San Juan, Puerto Rico, from a coastal video monitoring station. Image is compiled from 10 minutes of video and tracks the darkest pixels through 10 minutes of motion.

Isla Verde Video Camera 1 Timex
Time exposure image of Isla Verde in San Juan, Puerto Rico, from a coastal video monitoring station. Image represents a time-averaged image from 10 minutes of video.
Time exposure image of Isla Verde in San Juan, Puerto Rico, from a coastal video monitoring station. Image represents a time-averaged image from 10 minutes of video.

Isla Verde Video Camera 3 Variance Image
Variance image of Isla Verde in San Juan, Puerto Rico, from a coastal video monitoring station. Image is compiled from 10 minutes of video and shows areas of more movement as brighter colors.
Variance image of Isla Verde in San Juan, Puerto Rico, from a coastal video monitoring station. Image is compiled from 10 minutes of video and shows areas of more movement as brighter colors.

Salt Marsh Well Sensor
A well sensor continuously monitors salinity, temperature, and water level in a salt marsh, Cape Cod, MA
A well sensor continuously monitors salinity, temperature, and water level in a salt marsh, Cape Cod, MA

Isla Verde Video Camera 1 Variance Image
Variance image of Isla Verde in San Juan, Puerto Rico, from a coastal video monitoring station. Image is compiled from 10 minutes of video and shows areas of more movement as brighter colors.
Variance image of Isla Verde in San Juan, Puerto Rico, from a coastal video monitoring station. Image is compiled from 10 minutes of video and shows areas of more movement as brighter colors.

Isla Verde Video Camera 1 Dark Image
Dark image of Isla Verde in San Juan, Puerto Rico, from a coastal video monitoring station. Image is compiled from 10 minutes of video and tracks the darkest pixels through 10 minutes of motion.
Dark image of Isla Verde in San Juan, Puerto Rico, from a coastal video monitoring station. Image is compiled from 10 minutes of video and tracks the darkest pixels through 10 minutes of motion.

Video camera setup at Isla Verde
Shawn Harrison stands near video cameras on top of a building overlooking Isla Verde in San Juan, Puerto Rico. The cameras measure wave run-up and flooding as part of a study in response to Hurricane Irma and Hurricane Maria.
Shawn Harrison stands near video cameras on top of a building overlooking Isla Verde in San Juan, Puerto Rico. The cameras measure wave run-up and flooding as part of a study in response to Hurricane Irma and Hurricane Maria.

Gamma well detectors
Gamma well detectors are used to determine the ages of sediments based on activities of natural and anthropogenic radionuclides
Gamma well detectors are used to determine the ages of sediments based on activities of natural and anthropogenic radionuclides

Coulmeter
Dissolved inorganic carbon (DIC) in water samples is measured with a UIC, Inc. Coulometer
Dissolved inorganic carbon (DIC) in water samples is measured with a UIC, Inc. Coulometer

Isla Verde, San Juan, Puerto Rico
The urban reef at Isla Verde supports various species of protected corals, sea turtles, and crustaceans, as well as many Caribbean fish. It also protects the International Airport and numerous homes and resorts on the coast.
The urban reef at Isla Verde supports various species of protected corals, sea turtles, and crustaceans, as well as many Caribbean fish. It also protects the International Airport and numerous homes and resorts on the coast.
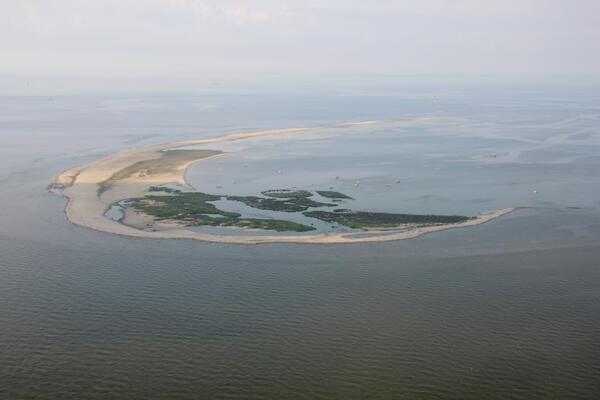
Aerial photograph looking southwest along Breton Island, Louisiana
Aerial photograph looking southwest along Breton Island, LouisianaAerial photograph looking southwest along Breton Island, Louisiana, taken July 2013
Aerial photograph looking southwest along Breton Island, Louisiana
Aerial photograph looking southwest along Breton Island, LouisianaAerial photograph looking southwest along Breton Island, Louisiana, taken July 2013

Wave-tide gauge off San Juan
Wave-tide gauge, pictured here on a coral reef amongst sea rods, brain corals, and sea fans, installed off Isla Verde in San Juan, Puerto Rico.
Wave-tide gauge, pictured here on a coral reef amongst sea rods, brain corals, and sea fans, installed off Isla Verde in San Juan, Puerto Rico.

Endicott Island, Alaska
Endicott Island, and artificial island built in 1987 by Alaska Interstate Construction and is used by BP and Hilcorp Alaska for petroleum production.
Endicott Island, and artificial island built in 1987 by Alaska Interstate Construction and is used by BP and Hilcorp Alaska for petroleum production.