
Image of trees taken from passenger window along 170 outside of Denver before sunset. Trees appear almost black and sky is blue with pink, orange and purple clouds.
Images
Images described and linked on this webpage come from a wide variety of USGS science activities and presentations performed by USGS Science Center staff members in the Region 7: Upper Colorado Basin. A search tool is provided to narrow the number of image files shown.
Filter Total Items: 551
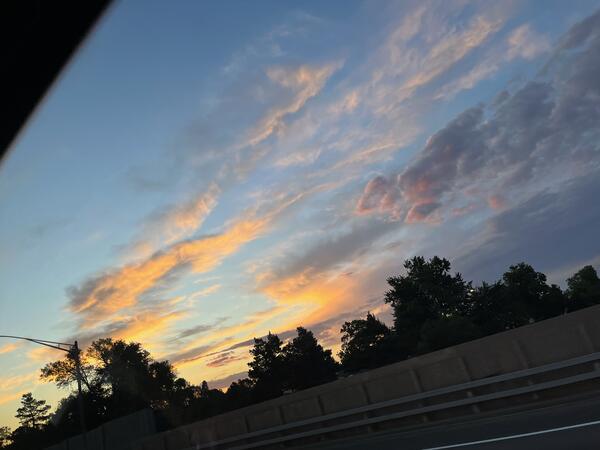
Denver Trees
Image of trees taken from passenger window along 170 outside of Denver before sunset. Trees appear almost black and sky is blue with pink, orange and purple clouds.

USGS scientists walk into the Rio Grande to collect water samples for a PFAS study near Valle de Oro, New Mexico.
USGS scientists walk into the Rio Grande to collect water samples for a PFAS study near Valle de Oro, New Mexico.USGS scientists Kimberly Beisner and Keely Miltenberger walk into the Rio Grande to collect water samples for a PFAS study near Valle de Oro, New Mexico.

Water quality sampler deployed on the Rio Grande in Alameda, New Mexico.
Water quality sampler deployed on the Rio Grande in Alameda, New Mexico.Water quality sampler deployed on the Rio Grande to collect an integrated sample of PFAS in the water in Alameda, New Mexico.
Water quality sampler deployed on the Rio Grande in Alameda, New Mexico.
Water quality sampler deployed on the Rio Grande in Alameda, New Mexico.Water quality sampler deployed on the Rio Grande to collect an integrated sample of PFAS in the water in Alameda, New Mexico.

USGS scientist retrieves water quality sensor on the Rio Grande in Albuquerque, New Mexico
USGS scientist retrieves water quality sensor on the Rio Grande in Albuquerque, New MexicoUSGS scientist Kimberly Beisner retrieves a water quality sensor on the Rio Grande for a PFAS study in Albuquerque, New Mexico.

Scientists travel by raft to collect samples in the Grand Canyon
Scientists travel by raft to collect samples in the Grand CanyonScientists travel by raft to collect various samples on the Colorado River in the Grand Canyon.
Scientists travel by raft to collect samples in the Grand Canyon
Scientists travel by raft to collect samples in the Grand CanyonScientists travel by raft to collect various samples on the Colorado River in the Grand Canyon.

LCR.Virtual.Tribal.Open_.House_.Image_11_29_2023.jpg
LCR.Virtual.Tribal.Open_.House_.Image_11_29_2023.jpgTitle Slide for Lower Colorado River Basin Panel Discussion for USGS Virtual Open House meeting to discuss drought issues with Native American Tribal Members. Held online via Microsoft Teams on November 29, 2024.

Upper Colorado River Basin streamflow, March-August 2023
Upper Colorado River Basin streamflow, March-August 2023March-August daily average streamflow for the last 30 years (1991-2022) (dark gray lines) compared to 2023, showing the periods where 2023 streamflow was above (blue) and below (orange) the historical average. Individual years of the relevant historical streamflow period are shown in light gray.

ASIST.Tribal.Open_.House_.B.Oct_.16.2023.jpg
Photograph taken at USGS ASIST Project Tribal Open House, Tucson, AZ, Oct. 16, 2023
Photograph taken at USGS ASIST Project Tribal Open House, Tucson, AZ, Oct. 16, 2023

ASIST.Tribal.Open_.House_.A.Oct_.16.2023.jpg
Photograph taken by Jessica Driscoll of USGS ASIST Project Tribal Open House, Tucson, AZ, Oct. 16, 2023
Photograph taken by Jessica Driscoll of USGS ASIST Project Tribal Open House, Tucson, AZ, Oct. 16, 2023
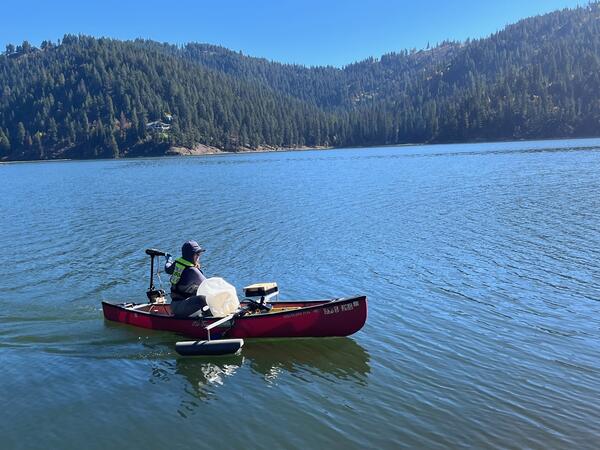
Field sampling by boat in Lake Fernan, Idaho
Collecting field samples to validate satellite remote sensing of water quality on Fernan Lake, Idaho.
Collecting field samples to validate satellite remote sensing of water quality on Fernan Lake, Idaho.

SIPI.Albuquerque.Tribal.Open_.House_A.Sept_.26.2023.JPG
SIPI.Albuquerque.Tribal.Open_.House_A.Sept_.26.2023.JPGPhotograph taken at USGS ASIST Project Open House related to Drought Issues in Tribal Lands in and near the Colorado River Basin, held at the Southwestern Indian Polytechnic Institute, Albuquerque, New Mexico, September 26, 2023

Panel Discussion at USGS ASIST Project Tribal Drought Issues Open House, Albuquerque, NM, Sept. 26, 2023
Panel Discussion at USGS ASIST Project Tribal Drought Issues Open House, Albuquerque, NM, Sept. 26, 2023Photograph of Panel Discussion at USGS ASIST Project Open House related to Drought Issues in Tribal Lands in and near the Colorado River Basin, held at the Southwestern Indian Polytechnic Institute, Albuquerque, New Mexico, September 26, 2023
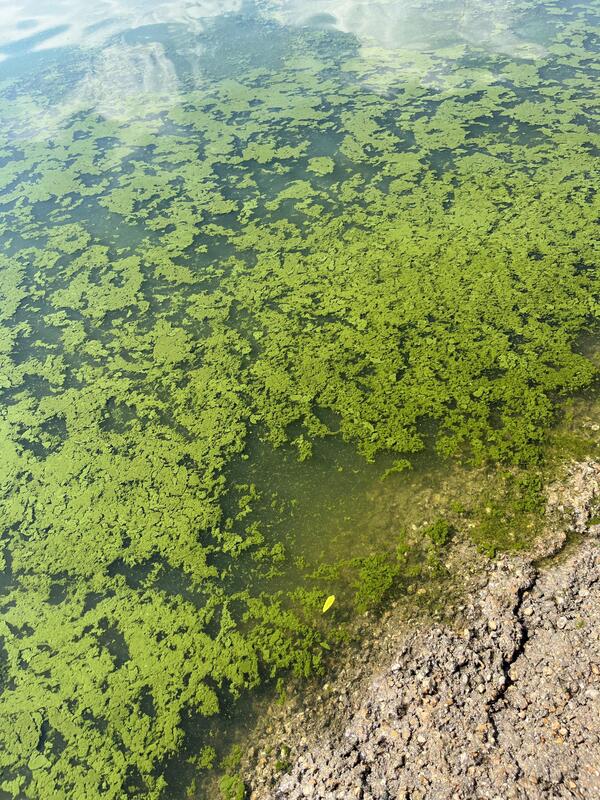
Cyanobacteria algae near the shore of Lake Lowell, Idaho
Cyanobacteria algae near the shore of Lake Lowell, IdahoCyanobacteria (a form of algae) accumulated near the shore of Lake Lowell, Idaho. Field samples from this site visit are used to validate satellite remote sensing of water quality.
Cyanobacteria algae near the shore of Lake Lowell, Idaho
Cyanobacteria algae near the shore of Lake Lowell, IdahoCyanobacteria (a form of algae) accumulated near the shore of Lake Lowell, Idaho. Field samples from this site visit are used to validate satellite remote sensing of water quality.
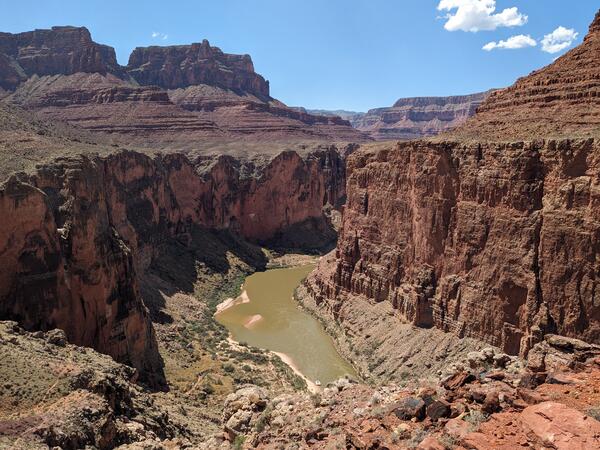
Grand_Canyon_20230908_Brennan.jpg
Photograph of the Colorado River in the Grand Canyon, Arizona, USA. Photo taken on September 8, 2023.
By
Core Science Systems Mission Area, Natural Hazards Mission Area, Water Resources Mission Area, Mineral Resources Program, National Cooperative Geologic Mapping Program, National Water Quality Program, Toxic Substances Hydrology, Geology, Geophysics, and Geochemistry Science Center, Geology, Minerals, Energy, and Geophysics Science Center, Geosciences and Environmental Change Science Center, New Mexico Water Science Center, Southwest Biological Science Center, Denver Radiogenic Isotope Lab, National Water Quality Laboratory, New Mexico Water Science Center Sediment Laboratory, Organic Geochemistry Laboratory, Geological Materials Repository, Geology and Ecology of National Parks, Colorado River Basin: Actionable and Strategic Integrated Science and Technology

Medicine Bow LLFA Survey Map
A map of the airborne geophysical survey area in the Medicine Mountains region of Wyoming
A map of the airborne geophysical survey area in the Medicine Mountains region of Wyoming

Researchers inject fluorescein dye into Lake Fork Creek, Colorado
Researchers inject fluorescein dye into Lake Fork Creek, ColoradoResearchers inject fluorescein dye into Lake Fork Creek, Colorado, in August 2023. This study aims to trace water flow from the historic Sugarloaf mining district into the creek.
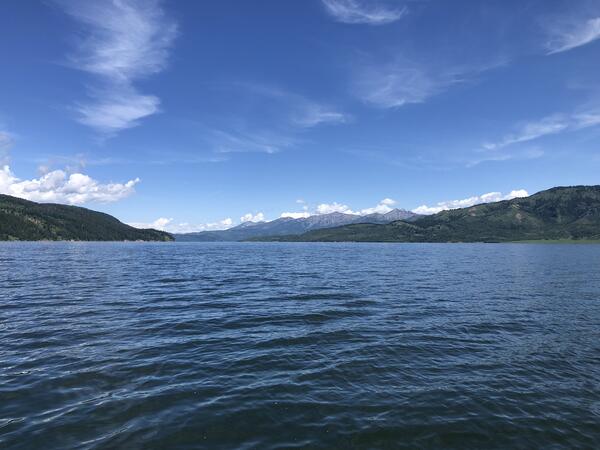
Palisades Reservoir on the Idaho-Wyoming border
View of Palisades Reservoir, on the Idaho-Wyoming border. This waterbody was included in a state-wide effort to validate satellite remote sensing of water quality.
View of Palisades Reservoir, on the Idaho-Wyoming border. This waterbody was included in a state-wide effort to validate satellite remote sensing of water quality.
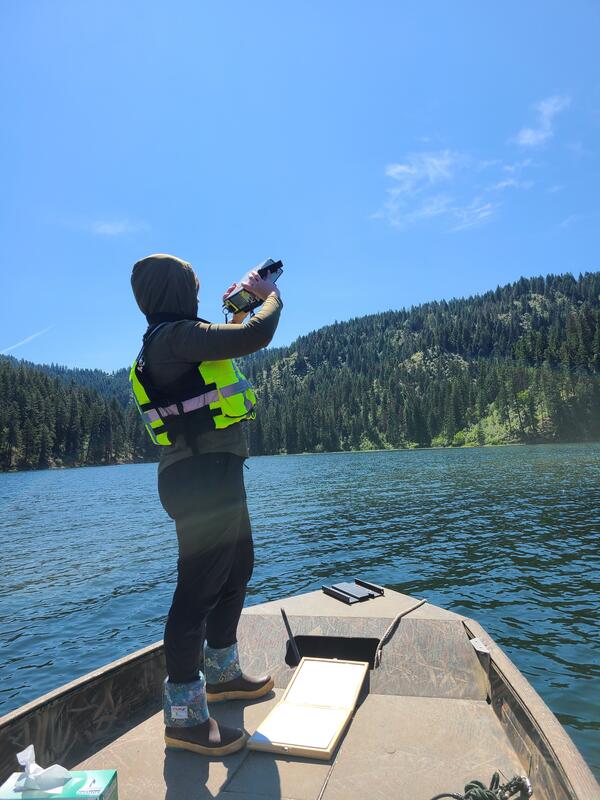
Spectral radiometer measurement on Fernan Lake, Idaho
Spectral radiometer measurement on Fernan Lake, IdahoValidating satellite observations of water quality includes measuring the incident lighting conditions. Here solar radiation is measured with a spectral radiometer on Fernan Lake, Idaho.
Spectral radiometer measurement on Fernan Lake, Idaho
Spectral radiometer measurement on Fernan Lake, IdahoValidating satellite observations of water quality includes measuring the incident lighting conditions. Here solar radiation is measured with a spectral radiometer on Fernan Lake, Idaho.
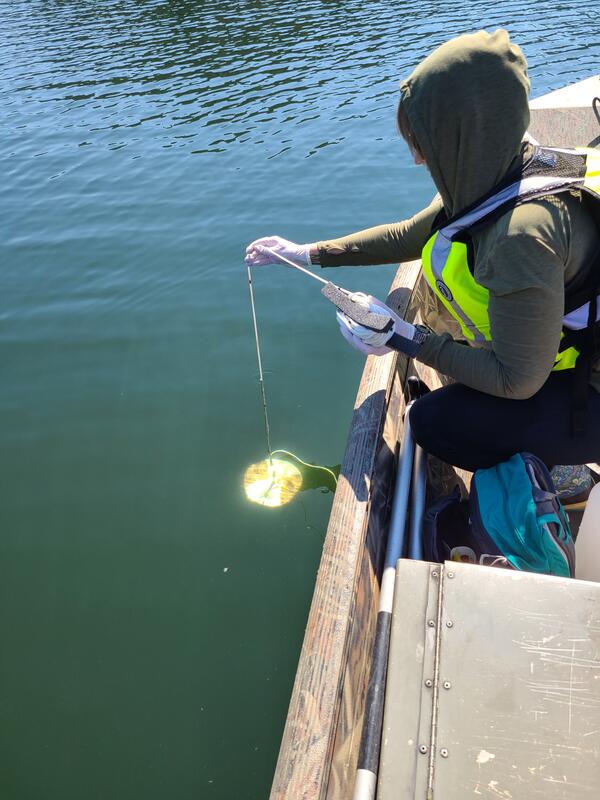
Secchi disk measurement on Lake Fernan, Idaho
Water clarity, a fundamental measure of water quality, is measured using a standard sized “Secchi” disk that is lowered until it is no longer visible. Measurements like this from Lake Fernan, Idaho, are used to validate satellite remote sensing estimates of water quality.
Water clarity, a fundamental measure of water quality, is measured using a standard sized “Secchi” disk that is lowered until it is no longer visible. Measurements like this from Lake Fernan, Idaho, are used to validate satellite remote sensing estimates of water quality.
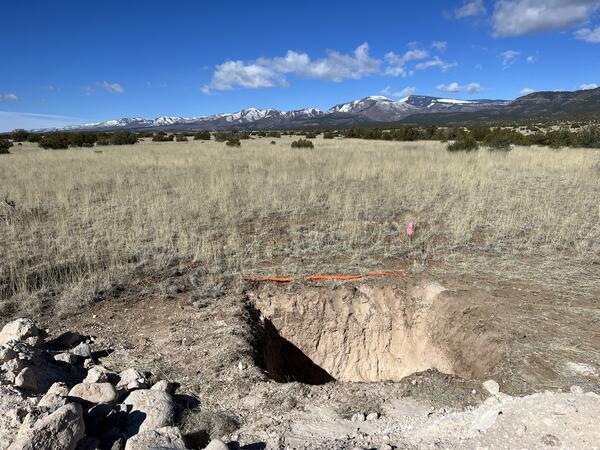
Puya Fault sampling pit
Pit dug for collection of geologic data and observations, such as geochronology samples to determine the age of faulted surfaces and documentation and dating of faulted recent sediments of the Puya Fault in northern New Mexico, 4/25/2023.
Pit dug for collection of geologic data and observations, such as geochronology samples to determine the age of faulted surfaces and documentation and dating of faulted recent sediments of the Puya Fault in northern New Mexico, 4/25/2023.

Montana
A view of the Boulder Mountains from US-12 west of Helena. These mountains lie at the north end of the Boulder Batholith.
A view of the Boulder Mountains from US-12 west of Helena. These mountains lie at the north end of the Boulder Batholith.