The USGS is assessing the physical condition of coastal wetlands and their response to external forces, using field observations and remote-sensing data. The U.S.
Neil Kamal Ganju, PhD
My research spans the multiple disciplines that converge in estuarine systems. Research projects include numerical model development, field observations of hydrodynamics and water quality, wetland and coastal vulnerability assessments, geomorphic change, and eutrophication.
In 2001, I began working for the USGS at the California Water Science Center, on the San Francisco Bay Sediment Transport Project with Dr. David Schoellhamer. In 2008 I moved to the Woods Hole Coastal and Marine Science Center and began multiple projects throughout the northeast US. The Estuarine Processes, Hazards, and Ecosystems project, started in 2015, details the past and ongoing studies we are involved with.
Professional Experience
2010-present: Research Oceanographer, Woods Hole Coastal and Marine Science Center
2008-2010: Hydraulic Engineer, Woods Hole Coastal and Marine Science Center
2001-2008: Hydraulic Engineer, California Water Science Center
Education and Certifications
I studied civil engineering at the University of Michigan (BSCE), the University of Florida (MSCE), and the University of California-Davis (Ph.D.).
Science and Products
Science to Support Marsh Conservation and Management Decisions in the Northeastern United States
Effects of Urban Coastal Armoring on Salt Marsh Sediment Supplies and Resilience to Climate Change
Coastal System Change at Fire Island, New York
Back-barrier and Estuarine - Coastal System Change at Fire Island, New York
Estuarine Processes, Hazards, and Ecosystems
Hurricane Sandy Response- Linking the Delmarva Peninsula's Geologic Framework to Coastal Vulnerability
Coastal Model Applications and Field Measurements
Estuarine Processes Tidal Wetlands
Estuarine Processes Coastal Hazards
Estuarine Processes Model Development
Lifespan of marsh units in Eastern Shore of Virginia salt marshes
Lifespan of marsh units in Connecticut salt marshes
Linear Ditches of Northeastern U.S. Coastal Marshes from Maine to Virginia Derived from 2023 2D Aerial Imagery Basemap
Time-series measurements of acoustic intensity, flow, pressure, water level, conductivity, temperature, and dissolved oxygen collected in a flooded cave at Cenote Bang, Yucatan Peninsula, Tulum, Mexico from March 25, 2018 to August 1, 2018
Supplementary data in support of oceanographic and water quality times-series measurements made at Thompsons Beach and Stone Harbor, NJ from September 2018 to February 2023
Idealized COAWST model cases for testing sensitivity of sediment transport and marsh accretion to vegetation, wave, and sediment parameters
Lifespan of marsh units in New York salt marshes
Geospatial characterization of salt marshes in Maine
Time-series measurements of oceanographic and water quality data collected at Thompsons Beach and Stone Harbor, New Jersey, USA, September 2018 to September 2019 and March 2022 to May 2023
Geospatial characterization of salt marshes in Connecticut (ver. 2.0, April 2024
Lifespan of Massachusetts salt marsh units
Water quality data from a multiparameter sonde collected in the Herring River during November 2018 to November 2019 in Wellfleet, MA
The USGS is assessing the physical condition of coastal wetlands and their response to external forces, using field observations and remote-sensing data. The U.S.
Box-cores provide a relatively undistributed look into the recent past to help better understand the processes contributing to sediment deposition and erosion.
Surface sediments will be analyzed for various physical parameters that will be used as initial conditions in hydrodynamic and sediment transport models.
Storm induced erosion of marsh shorelines can provide significant quantities of sediment to the bay altering the deposition patterns.
Inundated marsh at Forsythe National Wildlife Refuge, New Jersey.
Measuring seagrass biomass in Chincoteague Bay, Maryland to constrain numerical models.
Visualization of hydrodynamics around seagrass patch.
Inundated marsh at Forsythe National Wildlife Refuge, New Jersey.
Macroalgae, seagrass, and litter in West Falmouth Harbor, MA
Simulation results for geomorphic change in Suisun Bay, CA (Ganju and Schoellhamer, 2010)
Calculation of a suspended-sediment concentration-turbidity regression model and flood-ebb suspended-sediment concentration differentials from marshes near Stone Harbor and Thompsons Beach, New Jersey, 2018–19 and 2022–23
Biophysical drivers of coastal treeline elevation
Sea level rise is leading to the rapid migration of marshes into coastal forests and other terrestrial ecosystems. Although complex biophysical interactions likely govern these ecosystem transitions, projections of sea level driven land conversion commonly rely on a simplified “threshold elevation” that represents the elevation of the marsh-upland boundary based on tidal datums alone. To determine
Using geospatial analysis to guide marsh restoration in Chesapeake Bay and beyond
Calibrating optical turbidity measurements with suspended-sediment concentrations from the Herring River in Wellfleet, Massachusetts, from November 2018 to November 2019
Horizontal integrity a prerequisite for vertical stability: Comparison of elevation change and the unvegetated-vegetated marsh ratio across southeastern USA coastal wetlands
Increased utilization of storm surge barriers: A research agenda on estuary impacts
Buzzards Bay salt marshes: Vulnerability and adaptation potential
Variability in marsh migration potential determined by topographic rather than anthropogenic constraints in the Chesapeake Bay region
Development and application of Landsat-based wetland vegetation cover and unvegetated-vegetated marsh ratio (UVVR) for the conterminous United States
Modeling the dynamics of salt marsh development in coastal land reclamation
How much marsh restoration is enough to deliver wave attenuation coastal protection benefits?
Modeling marsh dynamics using a 3-D coupled wave-flow-sediment model
Non-USGS Publications**
(2016), Estimating time-dependent
connectivity in marine systems, Geophys.
Res. Lett., 43, doi:10.1002/2015GL066888.
**Disclaimer: The views expressed in Non-USGS publications are those of the author and do not represent the views of the USGS, Department of the Interior, or the U.S. Government.
U.S. Coastal Wetland Synthesis Applications Geonarrative
The U.S. Geological Survey (USGS) is assessing the physical condition of coastal wetlands and their response to external forces, using field observations and remote-sensing data.
National UVVR Map
This map shows the unvegetated and vegetated area of coastal wetlands and adjacent land (inland and shorelines) for the Conterminous United States computed from 2014-2018 Landsat imagery at ~30 meter horizontal resolution.
COAWST Modeling System v3.4
Science and Products
Science to Support Marsh Conservation and Management Decisions in the Northeastern United States
Effects of Urban Coastal Armoring on Salt Marsh Sediment Supplies and Resilience to Climate Change
Coastal System Change at Fire Island, New York
Back-barrier and Estuarine - Coastal System Change at Fire Island, New York
Estuarine Processes, Hazards, and Ecosystems
Hurricane Sandy Response- Linking the Delmarva Peninsula's Geologic Framework to Coastal Vulnerability
Coastal Model Applications and Field Measurements
Estuarine Processes Tidal Wetlands
Estuarine Processes Coastal Hazards
Estuarine Processes Model Development
Lifespan of marsh units in Eastern Shore of Virginia salt marshes
Lifespan of marsh units in Connecticut salt marshes
Linear Ditches of Northeastern U.S. Coastal Marshes from Maine to Virginia Derived from 2023 2D Aerial Imagery Basemap
Time-series measurements of acoustic intensity, flow, pressure, water level, conductivity, temperature, and dissolved oxygen collected in a flooded cave at Cenote Bang, Yucatan Peninsula, Tulum, Mexico from March 25, 2018 to August 1, 2018
Supplementary data in support of oceanographic and water quality times-series measurements made at Thompsons Beach and Stone Harbor, NJ from September 2018 to February 2023
Idealized COAWST model cases for testing sensitivity of sediment transport and marsh accretion to vegetation, wave, and sediment parameters
Lifespan of marsh units in New York salt marshes
Geospatial characterization of salt marshes in Maine
Time-series measurements of oceanographic and water quality data collected at Thompsons Beach and Stone Harbor, New Jersey, USA, September 2018 to September 2019 and March 2022 to May 2023
Geospatial characterization of salt marshes in Connecticut (ver. 2.0, April 2024
Lifespan of Massachusetts salt marsh units
Water quality data from a multiparameter sonde collected in the Herring River during November 2018 to November 2019 in Wellfleet, MA
The USGS is assessing the physical condition of coastal wetlands and their response to external forces, using field observations and remote-sensing data. The U.S.
Box-cores provide a relatively undistributed look into the recent past to help better understand the processes contributing to sediment deposition and erosion.
Surface sediments will be analyzed for various physical parameters that will be used as initial conditions in hydrodynamic and sediment transport models.
Storm induced erosion of marsh shorelines can provide significant quantities of sediment to the bay altering the deposition patterns.
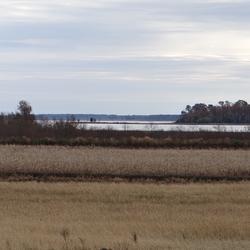
Inundated marsh at Forsythe National Wildlife Refuge, New Jersey.
Measuring seagrass biomass in Chincoteague Bay, Maryland to constrain numerical models.
Visualization of hydrodynamics around seagrass patch.
Inundated marsh at Forsythe National Wildlife Refuge, New Jersey.
Macroalgae, seagrass, and litter in West Falmouth Harbor, MA
Simulation results for geomorphic change in Suisun Bay, CA (Ganju and Schoellhamer, 2010)
Calculation of a suspended-sediment concentration-turbidity regression model and flood-ebb suspended-sediment concentration differentials from marshes near Stone Harbor and Thompsons Beach, New Jersey, 2018–19 and 2022–23
Biophysical drivers of coastal treeline elevation
Sea level rise is leading to the rapid migration of marshes into coastal forests and other terrestrial ecosystems. Although complex biophysical interactions likely govern these ecosystem transitions, projections of sea level driven land conversion commonly rely on a simplified “threshold elevation” that represents the elevation of the marsh-upland boundary based on tidal datums alone. To determine
Using geospatial analysis to guide marsh restoration in Chesapeake Bay and beyond
Calibrating optical turbidity measurements with suspended-sediment concentrations from the Herring River in Wellfleet, Massachusetts, from November 2018 to November 2019
Horizontal integrity a prerequisite for vertical stability: Comparison of elevation change and the unvegetated-vegetated marsh ratio across southeastern USA coastal wetlands
Increased utilization of storm surge barriers: A research agenda on estuary impacts
Buzzards Bay salt marshes: Vulnerability and adaptation potential
Variability in marsh migration potential determined by topographic rather than anthropogenic constraints in the Chesapeake Bay region
Development and application of Landsat-based wetland vegetation cover and unvegetated-vegetated marsh ratio (UVVR) for the conterminous United States
Modeling the dynamics of salt marsh development in coastal land reclamation
How much marsh restoration is enough to deliver wave attenuation coastal protection benefits?
Modeling marsh dynamics using a 3-D coupled wave-flow-sediment model
Non-USGS Publications**
(2016), Estimating time-dependent
connectivity in marine systems, Geophys.
Res. Lett., 43, doi:10.1002/2015GL066888.
**Disclaimer: The views expressed in Non-USGS publications are those of the author and do not represent the views of the USGS, Department of the Interior, or the U.S. Government.
U.S. Coastal Wetland Synthesis Applications Geonarrative
The U.S. Geological Survey (USGS) is assessing the physical condition of coastal wetlands and their response to external forces, using field observations and remote-sensing data.
National UVVR Map
This map shows the unvegetated and vegetated area of coastal wetlands and adjacent land (inland and shorelines) for the Conterminous United States computed from 2014-2018 Landsat imagery at ~30 meter horizontal resolution.