USGS collects data in the back-barrier at Fire Island
USGS collects data in the back-barrier at Fire IslandThe USGS uses observations and data collection in the back-barrier environment at Fire Island, NY to inform numerical models.


Official websites use .gov
A .gov website belongs to an official government organization in the United States.

Secure .gov websites use HTTPS
A lock () or https:// means you’ve safely connected to the .gov website. Share sensitive information only on official, secure websites.

St. Petersburg Coastal and Marine Science Center images.

The USGS uses observations and data collection in the back-barrier environment at Fire Island, NY to inform numerical models.
The USGS uses observations and data collection in the back-barrier environment at Fire Island, NY to inform numerical models.

USGS monitors the growth rates of the threatened Elkhorn Coral (Acropora palmata) at Dry Tortugas National Park (pictured) and throughout the Florida Keys, U.S.A.
USGS monitors the growth rates of the threatened Elkhorn Coral (Acropora palmata) at Dry Tortugas National Park (pictured) and throughout the Florida Keys, U.S.A.
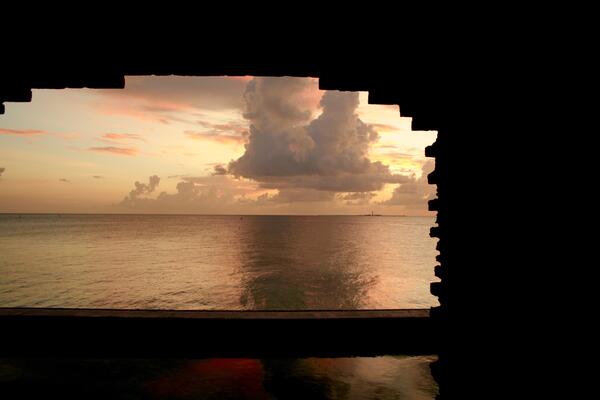
Looking at the sunset on the Gulf of America through a window of Fort Jefferson on Dry Torgugas National Park.
Looking at the sunset on the Gulf of America through a window of Fort Jefferson on Dry Torgugas National Park.

Joseph Terrano of the USGS St. Petersburg Coastal and Marine Science Center retrieves a sediment sample from under the marsh grass. Scientists installed several Net Sediment Tiles (NST) on the surface of the marsh to measure sediment deposition.
Joseph Terrano of the USGS St. Petersburg Coastal and Marine Science Center retrieves a sediment sample from under the marsh grass. Scientists installed several Net Sediment Tiles (NST) on the surface of the marsh to measure sediment deposition.

A rock breakwater and salt marsh planting act as the living shoreline structure along the Fog Point shoreline in Chesapeake Bay, Maryland.
A rock breakwater and salt marsh planting act as the living shoreline structure along the Fog Point shoreline in Chesapeake Bay, Maryland.

Scanning Electron Microscope (SEM) images of fossilized diatom specimens (microfossils). Diatoms are microscopic phytoplankton (algae) that are found in aquatic environments all over the world. Plankton species have preferences for different water and environmental conditions, such as salt or fresh water, attaching to sand or vegetation, or river versus estuary.
Scanning Electron Microscope (SEM) images of fossilized diatom specimens (microfossils). Diatoms are microscopic phytoplankton (algae) that are found in aquatic environments all over the world. Plankton species have preferences for different water and environmental conditions, such as salt or fresh water, attaching to sand or vegetation, or river versus estuary.

Snapshot, or first frame of from a 17-minute video shot on June 20, 2017, in Madeira Beach, Florida.
Snapshot, or first frame of from a 17-minute video shot on June 20, 2017, in Madeira Beach, Florida.

Time-averaged image, or “timex,” created by averaging the intensity of light recorded at each spot, or “pixel,” during a 17-minute video taken at Madeira Beach, Florida, on June 20, 2017. Blurred white bands show where waves are breaking. Offshore band shows location of a sand bar.
Time-averaged image, or “timex,” created by averaging the intensity of light recorded at each spot, or “pixel,” during a 17-minute video taken at Madeira Beach, Florida, on June 20, 2017. Blurred white bands show where waves are breaking. Offshore band shows location of a sand bar.

“Variance” image produced from video shot at Madeira Beach, Florida, on June 20, 2017. The more the light intensity changes at a given spot, or “pixel,” during the video, the brighter the value assigned to that pixel. Motion tends to produce changes in light intensity. Note bright bands parallel to shore where waves were breaking.
“Variance” image produced from video shot at Madeira Beach, Florida, on June 20, 2017. The more the light intensity changes at a given spot, or “pixel,” during the video, the brighter the value assigned to that pixel. Motion tends to produce changes in light intensity. Note bright bands parallel to shore where waves were breaking.

Photograph taken June 7, 2016, one day after Tropical Storm Colin, on Sunset Beach in the town of St. Pete Beach, Florida. Storm waves eroded the beach and dune, producing a cliff-like feature called a beach scarp.
Photograph taken June 7, 2016, one day after Tropical Storm Colin, on Sunset Beach in the town of St. Pete Beach, Florida. Storm waves eroded the beach and dune, producing a cliff-like feature called a beach scarp.

Photograph taken during Tropical Storm Colin, June 6, 2016, on Sunset Beach in the town of St. Pete Beach, Florida.
Photograph taken during Tropical Storm Colin, June 6, 2016, on Sunset Beach in the town of St. Pete Beach, Florida.
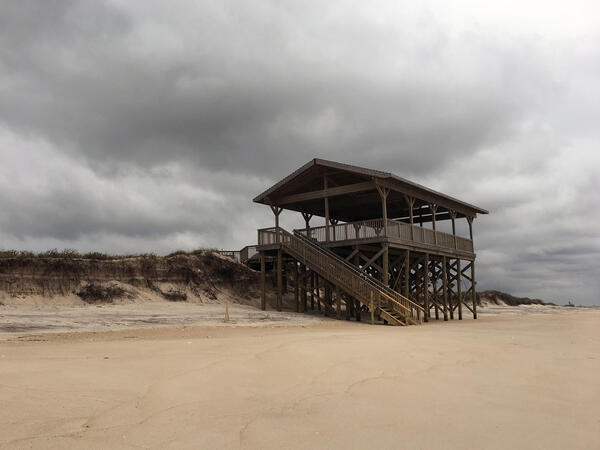
A pavilion/lookout deck with exposed support pilings after a series of storms, Fire Island, NY. Resources for beachgoers drive tourism for many coastal communities. Having boardwalks, seating, and walkways can enhance access to the beach. However, these structures are at risk of damage from high water events due to their proximity to the beach.
A pavilion/lookout deck with exposed support pilings after a series of storms, Fire Island, NY. Resources for beachgoers drive tourism for many coastal communities. Having boardwalks, seating, and walkways can enhance access to the beach. However, these structures are at risk of damage from high water events due to their proximity to the beach.


Scientists from the USGS St Petersburg Coastal and Marine Science Center (SPCMSC) capture the smooth water of the tidal creek reflecting a pastel sky and soft clouds while heading out for field work at early dawn.
Scientists from the USGS St Petersburg Coastal and Marine Science Center (SPCMSC) capture the smooth water of the tidal creek reflecting a pastel sky and soft clouds while heading out for field work at early dawn.

Scientists deploy a Chirp seismic instrument from the beach. Seismic data provide view of sub-seafloor geology, which records depositional and erosional events and reveals geologic controls on sediment supply.
Scientists deploy a Chirp seismic instrument from the beach. Seismic data provide view of sub-seafloor geology, which records depositional and erosional events and reveals geologic controls on sediment supply.

Samples are recovered from the sediment trap once every 9-12 months. Cruises to recover and redeploy the mooring take place on the UNOLS vessel, R/V Pelican, operated by LUMCON, in Cocodrie, Louisianna.
Samples are recovered from the sediment trap once every 9-12 months. Cruises to recover and redeploy the mooring take place on the UNOLS vessel, R/V Pelican, operated by LUMCON, in Cocodrie, Louisianna.

A net sedimentation tile (NST) is used by scientists to measure surface sediment deposition in wetlands over short time scales. Scientists installed several NSTs on the surface of the marsh to measure sediment deposition. The samples are retrieved and measured in the lab to identify short-term sediment deposition rates on the marsh surface.
A net sedimentation tile (NST) is used by scientists to measure surface sediment deposition in wetlands over short time scales. Scientists installed several NSTs on the surface of the marsh to measure sediment deposition. The samples are retrieved and measured in the lab to identify short-term sediment deposition rates on the marsh surface.

The USGS strives to put coastal change data and information at the fingertips of users such as planners and emergency managers. The explicit goal is to enable users to integrate and apply USGS data and tools to address their specific needs. Online resources such as the Coastal Change Hazards (CCH) portal are designed with applied use of data in mind.
The USGS strives to put coastal change data and information at the fingertips of users such as planners and emergency managers. The explicit goal is to enable users to integrate and apply USGS data and tools to address their specific needs. Online resources such as the Coastal Change Hazards (CCH) portal are designed with applied use of data in mind.
Participants at the September 2016 Argus Workshop at the U.S. Army Corps of Engineers Field Research Facility in Duck, North Carolina, including many of the scientists named in this article (labeled). Rob Holman (Oregon State University) took the photo with a drone.
Participants at the September 2016 Argus Workshop at the U.S. Army Corps of Engineers Field Research Facility in Duck, North Carolina, including many of the scientists named in this article (labeled). Rob Holman (Oregon State University) took the photo with a drone.

Schematic showing how sediment on the seafloor moves in response to a force created by the combined action of tides, ocean waves, and wind-driven currents.
Schematic showing how sediment on the seafloor moves in response to a force created by the combined action of tides, ocean waves, and wind-driven currents.

A healthy thicket of elkhorn coral, Acropora palmata in Buck Island Reef National Monument, St. Croix, U.S. Virgin Islands. This species is critical for shoreline protection because it is the only species that builds reef-crest habitat in the Caribbean region.
A healthy thicket of elkhorn coral, Acropora palmata in Buck Island Reef National Monument, St. Croix, U.S. Virgin Islands. This species is critical for shoreline protection because it is the only species that builds reef-crest habitat in the Caribbean region.