U.S. flag

An official website of the United States government

Images

Images

Filter Total Items: 9448
A map of the U.S. showing different colors for each state based on the value of minerals they produced in 2022.
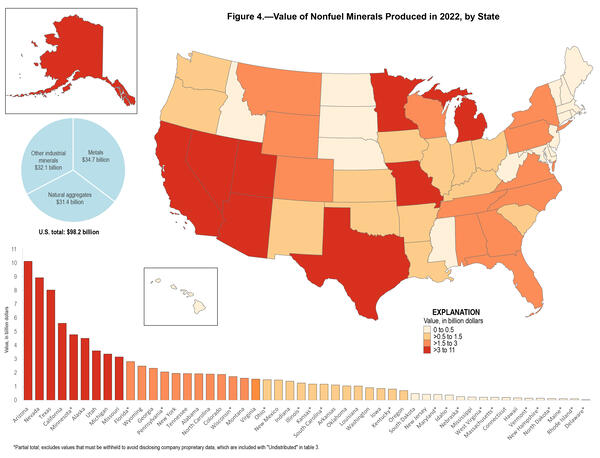
Map of the value of nonfuel minerals produced by each state in 2022

This map from the Mineral Commodity Summaries 2023 shows the value of nonfuel minerals produced by each state in 2022. The Mineral Commodity Summaries are issued annually by the USGS National Minerals Information Center and are the earliest comprehensive source of the previous year’s worldwide mineral industry data. USGS image.

This map from the Mineral Commodity Summaries 2023 shows the value of nonfuel minerals produced by each state in 2022. The Mineral Commodity Summaries are issued annually by the USGS National Minerals Information Center and are the earliest comprehensive source of the previous year’s worldwide mineral industry data. USGS image.

Illinois River Basin low-level flight map overview
Illinois River Basin low-level flight overview

This map shows the airborne geophysical survey area and planned flight paths across the Illinois River Basin in Illinois and northwest Indiana. Surveys will not occur directly above populated areas. Planned flight lines and survey progress can be found online

(USGS map) 

This map shows the airborne geophysical survey area and planned flight paths across the Illinois River Basin in Illinois and northwest Indiana. Surveys will not occur directly above populated areas. Planned flight lines and survey progress can be found online

(USGS map) 

Hunga Tonga pressure waves
Hunga Tonga 2.JPG
Hunga Tonga 2.JPG
Hunga Tonga 2.JPG

The large HTHH volcanic explosion created fast low-frequency pressure waves that penetrated about 3.1 miles/5 kilometers into the shallow crust (shown in yellow). Wind and small explosions (shown in blue) create shorter pressure waves that only penetrate down about 328 feet/100 meters.

The large HTHH volcanic explosion created fast low-frequency pressure waves that penetrated about 3.1 miles/5 kilometers into the shallow crust (shown in yellow). Wind and small explosions (shown in blue) create shorter pressure waves that only penetrate down about 328 feet/100 meters.

Waveforms from Hunga Tonga eruption
Hunga Tonga 3.JPG
Hunga Tonga 3.JPG
Hunga Tonga 3.JPG

The waveforms of the ground motion recording and the pressure sensor recording from a station with both types of instruments (see second image above) match up, indicating that the pressure waves are causing the ground (crust) to deflect.

The waveforms of the ground motion recording and the pressure sensor recording from a station with both types of instruments (see second image above) match up, indicating that the pressure waves are causing the ground (crust) to deflect.

woman taking measurements at stream gage
High water mark on streamgage 11161000 San-Lorenzo-River Santa-Cruz

Sharon Mulready, USGS Hydrologic Technician, recording the high-water mark on gage 11161000 San Lorenzo River Santa Cruz. The stream is filled with a tremendous amount of sediment moved by the storm on December 31st, 2022.

High water in the Walnut Creek watershed in Raleigh, North Carolina, in 2022.
High water in the Walnut Creek watershed

High water in the Walnut Creek watershed in Raleigh, North Carolina, in 2022. Flooding can impact nearby infrastructure, including homes, businesses, roads and trails. Credit: Kristina Hopkins, USGS.

High water in the Walnut Creek watershed in Raleigh, North Carolina, in 2022. Flooding can impact nearby infrastructure, including homes, businesses, roads and trails. Credit: Kristina Hopkins, USGS.

Scientists digging trench in Sawtooth National Forest, 2022
Sawtooth2.png
Sawtooth2.png
Sawtooth2.png

USGS scientists in Sawtooth National Forest, 2022, digging a trench similar to what will be opened in White River National Forest. 

USGS scientists in Sawtooth National Forest, 2022, digging a trench similar to what will be opened in White River National Forest. 

A USGS map of the U.S. with dots representing tap water sample sites across the nation, varying in size and shade of blue to
PFAS in Select U.S. Tapwater Locations

This USGS map shows the number of PFAS detected in tap water samples from select sites across the nation. The findings are based on a USGS study of samples taken between 2016 and 2021 from private and public supplies at 716 locations. The map does not represent the only locations in the U.S. with PFAS.  

This USGS map shows the number of PFAS detected in tap water samples from select sites across the nation. The findings are based on a USGS study of samples taken between 2016 and 2021 from private and public supplies at 716 locations. The map does not represent the only locations in the U.S. with PFAS.  

A gloved hand holds a splotchy frog in front of a scenic wetland with mountains in the background
Columbia Spotted Frog (Rana Luteiventris) in Montana.

A Columbia spotted frog (Rana Luteiventris) collected for methylmercury sampling in Montana.

Screen shot of the USGS Coastal Change Hazards Portal showing potential coastal change impacts from Hurricane Ida in 2021.
USGS Coastal Change Hazards Portal for Hurricane Ida

Screen shot of the USGS Coastal Change Hazards Portal showing potential coastal change impacts from Hurricane Ida in 2021.

A butte dotted with scrubby trees reaches to the cloud-spotted sku
Red Butte
Red Butte
Red Butte

Red Butte, Arizona. Near Grand Canyon in Kaibab National Forest. Photo bu Jo Ellen Hinck.

Red Butte, Arizona. Near Grand Canyon in Kaibab National Forest. Photo bu Jo Ellen Hinck.

Extratropical Typhoon Merbok

Extratropical Typhoon Merbok spins off the Alaskan coast. Credit: National Weather Service.

Blue tilapia
Blue Tilapia
Blue Tilapia
Blue Tilapia

Blue tilapia, an invasive species that potentially spread to new locations in Florida following Hurricane Ian.

Blue tilapia, an invasive species that potentially spread to new locations in Florida following Hurricane Ian.

A rusty patched bumblebee visits a purple flower in a meadow of lots of purple and yellow flowers.
A rusty patched bumblebee visits a flower

What can you do to conserve the birds and the bees, even in the face of climate change? In some cases, small actions, such as maintaining a pollinator garden or avoiding pesticides can be important. Take the rusty patched bumble bee, once one of the most common pollinators in eastern North America.

What can you do to conserve the birds and the bees, even in the face of climate change? In some cases, small actions, such as maintaining a pollinator garden or avoiding pesticides can be important. Take the rusty patched bumble bee, once one of the most common pollinators in eastern North America.

Culex mosquito eggs are viewed under a mircroscope
Culex mosquito eggs
Culex mosquito eggs
Culex mosquito eggs

A group of controlled Culex mosquito eggs are viewed under a microscope in a California laboratory as part of an effort to mitigate avian malaria throughout the Hawaiian Islands. Image by Mia Takai 

A group of controlled Culex mosquito eggs are viewed under a microscope in a California laboratory as part of an effort to mitigate avian malaria throughout the Hawaiian Islands. Image by Mia Takai 

comic cover mars ice panel 1
Icy Mystery on Mars (Panel 1)

Panel 1 of Icy Mystery Discovery of Ice on Mars science comic. (Mars' Climate History)

comic cover mars ice panel 4
Icy Mystery on Mars (Panel 4)

Panel 4 of science comic about Icy Mystery - Ice on Mars. This panel shows a whimsical future of how scientists can use new information about ice on Mars.

Panel 4 of science comic about Icy Mystery - Ice on Mars. This panel shows a whimsical future of how scientists can use new information about ice on Mars.

comic cover mars ice panel 2
Icy Mystery on Mars (Panel 2)

Panel 2 for science comic about Icy Mystery - Ice on Mars. This panel explores the actual Dec. 24, 2021 Impact.

Panel 2 for science comic about Icy Mystery - Ice on Mars. This panel explores the actual Dec. 24, 2021 Impact.

comic cover mars ice panel 3
Icy Mystery on Mars (Panel 3)

Panel 3 of science comic about Icy Mystery - Ice on Mars. This panel shows instruments used to study subsurface.

Panel 3 of science comic about Icy Mystery - Ice on Mars. This panel shows instruments used to study subsurface.

comic cover mars ice
Icy Mystery on Mars (COVER)

Cover for science comic about Icy Mystery - Ice on Mars. The comic is about the discovery of ice at 35 degrees North on Mars' surface.

Cover for science comic about Icy Mystery - Ice on Mars. The comic is about the discovery of ice at 35 degrees North on Mars' surface.

Was this page helpful?