
A group of controlled Culex mosquito eggs are viewed under a microscope in a California laboratory as part of an effort to mitigate avian malaria throughout the Hawaiian Islands. Image by Mia Takai
Images
Images
Filter Total Items: 9454

Culex mosquito eggs
A group of controlled Culex mosquito eggs are viewed under a microscope in a California laboratory as part of an effort to mitigate avian malaria throughout the Hawaiian Islands. Image by Mia Takai

Icy Mystery on Mars (Panel 1)
Panel 1 of Icy Mystery Discovery of Ice on Mars science comic. (Mars' Climate History)
Panel 1 of Icy Mystery Discovery of Ice on Mars science comic. (Mars' Climate History)

Icy Mystery on Mars (Panel 4)
Panel 4 of science comic about Icy Mystery - Ice on Mars. This panel shows a whimsical future of how scientists can use new information about ice on Mars.
Panel 4 of science comic about Icy Mystery - Ice on Mars. This panel shows a whimsical future of how scientists can use new information about ice on Mars.

Icy Mystery on Mars (Panel 2)
Panel 2 for science comic about Icy Mystery - Ice on Mars. This panel explores the actual Dec. 24, 2021 Impact.
Panel 2 for science comic about Icy Mystery - Ice on Mars. This panel explores the actual Dec. 24, 2021 Impact.

Icy Mystery on Mars (Panel 3)
Panel 3 of science comic about Icy Mystery - Ice on Mars. This panel shows instruments used to study subsurface.
Panel 3 of science comic about Icy Mystery - Ice on Mars. This panel shows instruments used to study subsurface.

Icy Mystery on Mars (COVER)
Cover for science comic about Icy Mystery - Ice on Mars. The comic is about the discovery of ice at 35 degrees North on Mars' surface.
Cover for science comic about Icy Mystery - Ice on Mars. The comic is about the discovery of ice at 35 degrees North on Mars' surface.
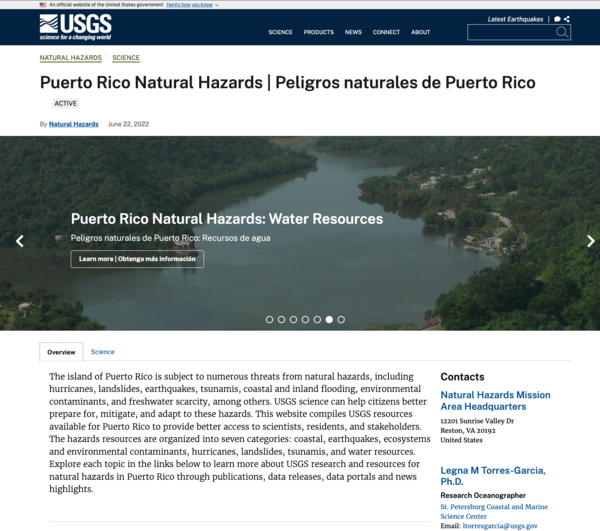
Puerto Rico Natural Hazards webpages
Las páginas web del USGS acerca de los peligros naturales de Puerto Rico se pueden acceder visitando: https://www.usgs.gov/mission-areas/natural-hazards/science/puerto-rico-natural-hazards-peligros-naturales-de-puerto-rico.
Las páginas web del USGS acerca de los peligros naturales de Puerto Rico se pueden acceder visitando: https://www.usgs.gov/mission-areas/natural-hazards/science/puerto-rico-natural-hazards-peligros-naturales-de-puerto-rico.

Infographic on Black Carp in the Mississippi River Basin
Infographic on Black Carp in the Mississippi River BasinAn infographic highlighting a study finding that black carp, which are an invasive fish species in North America, are now known to be established in the wild in parts of the Mississippi River basin. The infographic was created by the USGS. The USGS was one of the study’s co-authors and the research was led by Southern Illinois University.

Black Carp Observations in the Mississippi River Basin
Black Carp Observations in the Mississippi River BasinA map of black carp observations in the Mississippi River basin reported to the USGS Nonindigenous Aquatic Species database as of November 30, 2022. This map is not a complete representation of species abundance or distribution. These data include incidental captures by the public and reports from federal and state agencies.
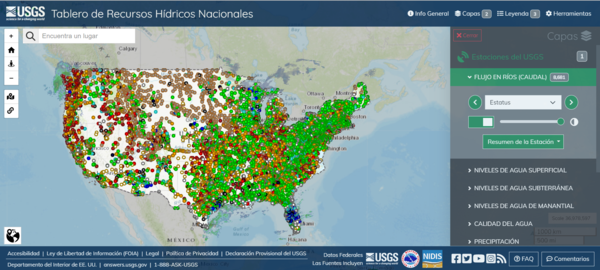
Spanish version of National Water Dashboard
This is a screenshot of the Spanish version of the National Water Dashboard (NWD). The NWD presents real-time stream, lake and reservoir, precipitation and groundwater data from more than 13,500 USGS observation stations across the country.
This is a screenshot of the Spanish version of the National Water Dashboard (NWD). The NWD presents real-time stream, lake and reservoir, precipitation and groundwater data from more than 13,500 USGS observation stations across the country.

Bipartisan Infrastructure Law Investments
With increased funding through the Bipartisan Infrastructure Law, the USGS can accelerate its mission of surveying the Nation’s natural resources. The additional funds will largely be directed toward these three main investments in science.
With increased funding through the Bipartisan Infrastructure Law, the USGS can accelerate its mission of surveying the Nation’s natural resources. The additional funds will largely be directed toward these three main investments in science.

Satellite Image of Tropical Storm Nicole
A satellite image of Tropical Storm Nicole off the coast of Florida. NOAA image.
A satellite image of Tropical Storm Nicole off the coast of Florida. NOAA image.

The Aleutian Cradle of Tsunamis
THE ALEUTIAN CRADLE OF TSUNAMIS
(Click here to read EOS Feature: Seismic Sources in the Aleutian Cradle of Tsunamis)

Pennington Mountain Critical Minerals Earth MRI Geophysical Scan
Pennington Mountain Critical Minerals Earth MRI Geophysical ScanThe anomaly at Pennington Mountain is visible in the geophysical data collected in aerial surveys conducted in 2021.
Pennington Mountain Critical Minerals Earth MRI Geophysical Scan
Pennington Mountain Critical Minerals Earth MRI Geophysical ScanThe anomaly at Pennington Mountain is visible in the geophysical data collected in aerial surveys conducted in 2021.
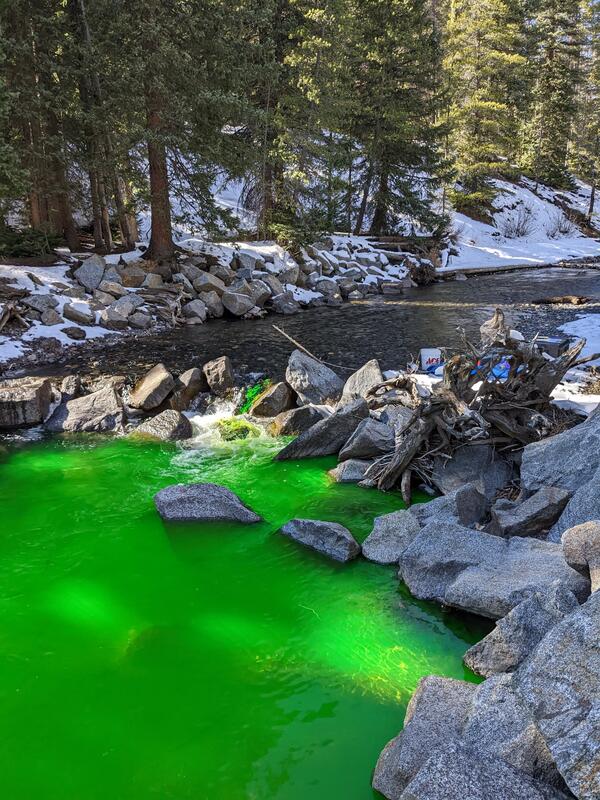
Dye injection into the Slate River, Colorado
Sodium fluorescein dye injection into the Slate River used to measure how much groundwater flows into it.
Sodium fluorescein dye injection into the Slate River used to measure how much groundwater flows into it.
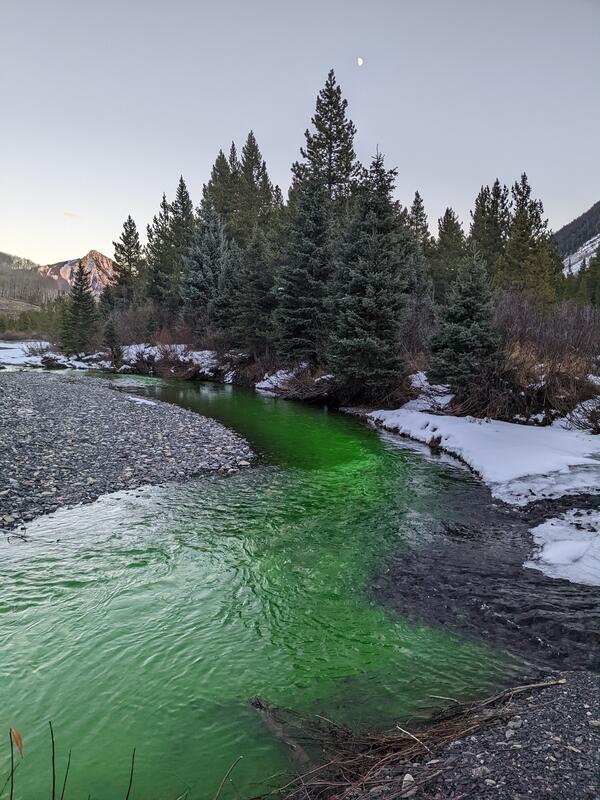
Dye tracer study in the Slate River, Colorado
Sodium fluorescein dye injection into the Slate River used to measure how much groundwater flows into it.
Sodium fluorescein dye injection into the Slate River used to measure how much groundwater flows into it.
Satellite Image of Tropical Storm Nicole
A satellite image of Tropical Storm Nicole off the coast of Florida. NOAA image.
A satellite image of Tropical Storm Nicole off the coast of Florida. NOAA image.

Pennington Mountain Rock with Critical Minerals
A fine-grained volcanic rock (trachyte) that hosts rare earth elements, niobium, and zirconium, all which are considered critical mineral resources. This rock was found on Pennington Mountain in Maine. Image courtesy of Chunzeng Wang, University of Maine-Presque Isle.
A fine-grained volcanic rock (trachyte) that hosts rare earth elements, niobium, and zirconium, all which are considered critical mineral resources. This rock was found on Pennington Mountain in Maine. Image courtesy of Chunzeng Wang, University of Maine-Presque Isle.

Some ways USGS science has evolved since Hurricane Sandy
Some ways USGS science has evolved since Hurricane SandyA snapshot of some ways USGS science has evolved since Hurricane Sandy. USGS image.
Some ways USGS science has evolved since Hurricane Sandy
Some ways USGS science has evolved since Hurricane SandyA snapshot of some ways USGS science has evolved since Hurricane Sandy. USGS image.

Piper Navajo fixed-wing aircraft with rear facing stinger magnetometer
Piper Navajo fixed-wing aircraft with rear facing stinger magnetometerA Piper Navajo fixed-wing aircraft with rear facing stinger magnetometer. Credit: New-Sense Geophysics Limited
Piper Navajo fixed-wing aircraft with rear facing stinger magnetometer
Piper Navajo fixed-wing aircraft with rear facing stinger magnetometerA Piper Navajo fixed-wing aircraft with rear facing stinger magnetometer. Credit: New-Sense Geophysics Limited

Legna Torres-Garcia with oceanographic instrumentation
Legna Torres-Garcia with oceanographic instrumentationLegna Torres-Garcia deploys oceanographic instrumentation to measure waves, currents, water temperature and water levels in Dorado, Puerto Rico in October 2022. This deployment will improve computer model accuracy related to total water level forecast. USGS Photo by David Thompson.