EARTHQUAKES: WHAT YOU FEEL
EARTHQUAKE INTENSITY

Official websites use .gov
A .gov website belongs to an official government organization in the United States.
Secure .gov websites use HTTPS
A lock () or https:// means you’ve safely connected to the .gov website. Share sensitive information only on official, secure websites.
Images

EARTHQUAKES: WHAT YOU FEEL
EARTHQUAKE INTENSITY
EARTHQUAKES: WHAT YOU FEEL
EARTHQUAKE INTENSITY
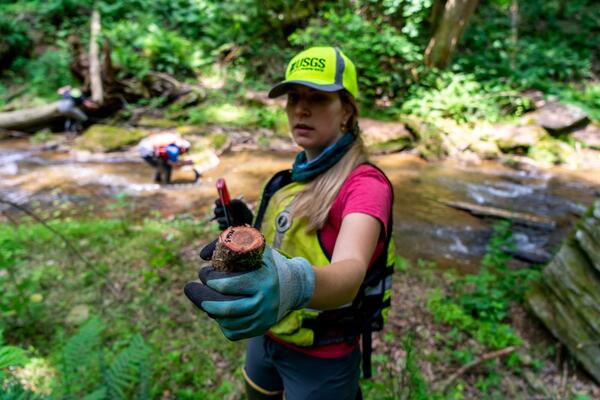
Molly Huber holds out a freshly cut root cookie in Pennsylvania. Root cookies help scientists study stream bank erosion.
Molly Huber holds out a freshly cut root cookie in Pennsylvania. Root cookies help scientists study stream bank erosion.

Smoke filled the skies over western Canada and even much of the United States in May 2023. The source was several wildfires in Alberta and British Columbia.
Near the end of May, rain and cooler temperatures finally brought some relief for the out-of-control fires.
Smoke filled the skies over western Canada and even much of the United States in May 2023. The source was several wildfires in Alberta and British Columbia.
Near the end of May, rain and cooler temperatures finally brought some relief for the out-of-control fires.

Topobathymetric digital elevation model of the confluence of the Potomac and Shenandoah Rivers at Harper’s Ferry, West Virginia.
Topobathymetric digital elevation model of the confluence of the Potomac and Shenandoah Rivers at Harper’s Ferry, West Virginia.


Map of the Potomac River topobathymetric lidar survey area in Virginia, Maryland, and West Virginia.
Map of the Potomac River topobathymetric lidar survey area in Virginia, Maryland, and West Virginia.

Drawing showing climate change impacts to each life cycle stage of monarchs: 1) Butterflies lay fewer eggs in wetter conditions, 2) Warmer temperatures reduce milkweed growth, leaving caterpillars hungry, 3) Erratic winters freeze overwintering pupae, 4) Shifting seasons disrupt migrations.
Drawing showing climate change impacts to each life cycle stage of monarchs: 1) Butterflies lay fewer eggs in wetter conditions, 2) Warmer temperatures reduce milkweed growth, leaving caterpillars hungry, 3) Erratic winters freeze overwintering pupae, 4) Shifting seasons disrupt migrations.

This image shows Hurricane Ian making its first U.S. landfall in southwest Florida near Cayo Costa September 28, 2022, bringing with it extreme storm surge, category 4 winds and a deluge of rain. Ian made a second U.S. landfall September 30, 2022, in Georgetown, South Carolina. Photos by NOAA.
This image shows Hurricane Ian making its first U.S. landfall in southwest Florida near Cayo Costa September 28, 2022, bringing with it extreme storm surge, category 4 winds and a deluge of rain. Ian made a second U.S. landfall September 30, 2022, in Georgetown, South Carolina. Photos by NOAA.

Aidan Ford, a citizen-scientist, holds up two juvenile Ringed Map Turtles during fieldwork with the U.S. Geological Survey, on May 5, 2023 on the Bouge Falaya river, in Louisiana. (Courtesy photo).
Aidan Ford, a citizen-scientist, holds up two juvenile Ringed Map Turtles during fieldwork with the U.S. Geological Survey, on May 5, 2023 on the Bouge Falaya river, in Louisiana. (Courtesy photo).

The Yurok Tribe’s Condor Aviation and Fisheries Department collect LiDAR data on the Klamath River in Northern California.
The Yurok Tribe’s Condor Aviation and Fisheries Department collect LiDAR data on the Klamath River in Northern California.

Hexavalent chromium, a known carcinogen under specific circumstances, occurs naturally in groundwater in the Mojave Desert. However, concentrations of hexavalent chromium increased in California’s Hinkley Valley beginning in 1952 when the Pacific Gas and Electric Company (PG&E) discharged it into unlined ponds.
Hexavalent chromium, a known carcinogen under specific circumstances, occurs naturally in groundwater in the Mojave Desert. However, concentrations of hexavalent chromium increased in California’s Hinkley Valley beginning in 1952 when the Pacific Gas and Electric Company (PG&E) discharged it into unlined ponds.

A view of the Boulder Mountains from US-12 west of Helena. These mountains lie at the north end of the Boulder Batholith.
A view of the Boulder Mountains from US-12 west of Helena. These mountains lie at the north end of the Boulder Batholith.

Lidar point cloud image taken above of the Hoover Dam in Nevada. Image was created by Jason Stoker.
Lidar point cloud image taken above of the Hoover Dam in Nevada. Image was created by Jason Stoker.

A Pacific Gas and Electric Company (PG&E) compressor station in Hinkley, California. Although hexavalent chromium occurs naturally in the groundwater of the Mojave Desert, concentrations increased in Hinkley Valley beginning in 1952.
A Pacific Gas and Electric Company (PG&E) compressor station in Hinkley, California. Although hexavalent chromium occurs naturally in the groundwater of the Mojave Desert, concentrations increased in Hinkley Valley beginning in 1952.
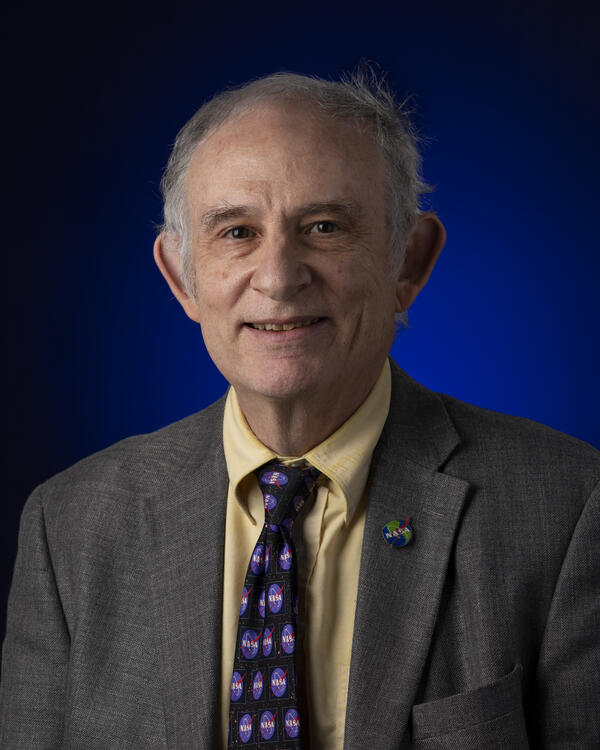
Recipient of the 2024 Pecora Individual Award Jack A. Kaye, PhD. This photo was added to Drupal for use in related feature story.
Recipient of the 2024 Pecora Individual Award Jack A. Kaye, PhD. This photo was added to Drupal for use in related feature story.

Although most economic loss is concentrated along the west coast, the distribution of relative earthquake risk, as measured by the Annualized Earthquake Loss Ratio (AELR), is spread throughout the country and it reinforces the fact that earthquakes are a national problem.
Although most economic loss is concentrated along the west coast, the distribution of relative earthquake risk, as measured by the Annualized Earthquake Loss Ratio (AELR), is spread throughout the country and it reinforces the fact that earthquakes are a national problem.

Map showing distribution of average annualized earthquake loss by region. The high concentration of loss in California and the West Coast is consistent with that region’s high seismic hazard, significant population, and building exposure.
Map showing distribution of average annualized earthquake loss by region. The high concentration of loss in California and the West Coast is consistent with that region’s high seismic hazard, significant population, and building exposure.

Children play with 12’x12′ interactive floor puzzle of the Navajo Nation, created from Landsat satellite imagery by Earth observation education partner, AmericaView during the Nihima Nahasdzáán−The Art of Mother Earth Gallery Event.
Children play with 12’x12′ interactive floor puzzle of the Navajo Nation, created from Landsat satellite imagery by Earth observation education partner, AmericaView during the Nihima Nahasdzáán−The Art of Mother Earth Gallery Event.

Mail in deceased butterflies, moths, and skippers and help United States Geological Survey(USGS) scientists establish a Lepidoptera Research Collection (LRC). Specimens will help USGS scientists identify contaminants and environmental factors which may be contributing to the decline of insect populations.
Mail in deceased butterflies, moths, and skippers and help United States Geological Survey(USGS) scientists establish a Lepidoptera Research Collection (LRC). Specimens will help USGS scientists identify contaminants and environmental factors which may be contributing to the decline of insect populations.

Airborne lidar point cloud image of downtown Chicago, Illinois skyline. Image created by Jason Stoker.
Airborne lidar point cloud image of downtown Chicago, Illinois skyline. Image created by Jason Stoker.

This map of the United States and its territories shows geographic extent of planned, existing, and in-progress 3DEP data acquisition projects.
This map of the United States and its territories shows geographic extent of planned, existing, and in-progress 3DEP data acquisition projects.