
TERNS EAT KRILL AND FORAGE FISH LIKE HERRING AND SAND LANCE. USUALLY, THAT'S A NUTRITIOUS DIET. BUT WHEN HARMFUL ALGAL BLOOMS OCCUR, TOXINS CAN TAINT THE FOOD WEB FOR THE BIRDS.
Images
Images
Filter Total Items: 9454

A Long-Suspected Culprit is Caught - Panel 7
TERNS EAT KRILL AND FORAGE FISH LIKE HERRING AND SAND LANCE. USUALLY, THAT'S A NUTRITIOUS DIET. BUT WHEN HARMFUL ALGAL BLOOMS OCCUR, TOXINS CAN TAINT THE FOOD WEB FOR THE BIRDS.

A Long-Suspected Culprit is Caught - Panel 4
SEABIRD DIE-OFFS IN ALASKA ARE BECOMING MORE FREQUENT. ALTHOUGH RESEARCHERS BELIEVE MOST BIRDS STARVE DURING THESE EVENTS, THERE MAY BE SOMETHING ELSE CONTRIBUTING TO SOME OF THE DEATHS -- HARMFUL ALGAL BLOOMS.
SEABIRD DIE-OFFS IN ALASKA ARE BECOMING MORE FREQUENT. ALTHOUGH RESEARCHERS BELIEVE MOST BIRDS STARVE DURING THESE EVENTS, THERE MAY BE SOMETHING ELSE CONTRIBUTING TO SOME OF THE DEATHS -- HARMFUL ALGAL BLOOMS.
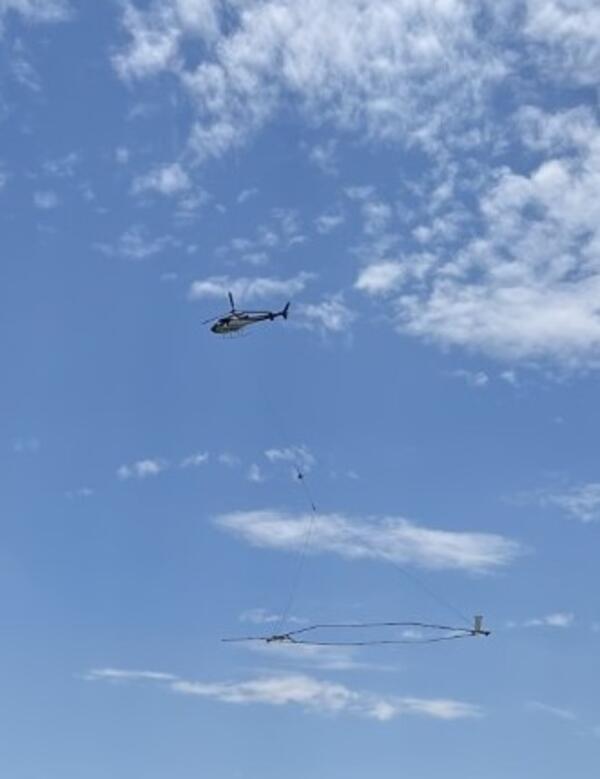
Helicopter towing large sensor
This helicopter will fly along pre-planned flight paths in the Coalinga area at a relatively low to the ground at 100-200 feet above the surface. A sensor that resembles a large hula-hoop will be towed beneath the helicopter to measure small electromagnetic signals that can be used to map geologic features below Earth’s surface.
This helicopter will fly along pre-planned flight paths in the Coalinga area at a relatively low to the ground at 100-200 feet above the surface. A sensor that resembles a large hula-hoop will be towed beneath the helicopter to measure small electromagnetic signals that can be used to map geologic features below Earth’s surface.

Landsat 8 Image of Washburn Fire, Yosemite National Park - July 7, 2022
Landsat 8 Image of Washburn Fire, Yosemite National Park - July 7, 2022The Landsat 8 thermal image of the Washburn fire was acquired at night to pinpoint the location (bright white) of heat from the fire as it began. Firefighters immediately focused on suppressing the wildfire to minimize any effects on the Mariposa Grove of Giant Sequoias. As of July 18, 2022, the fire covered nearly 5,000 acres.

Landsat 9 Image of Washburn Fire, Yosemite National Park - July 7, 2022
Landsat 9 Image of Washburn Fire, Yosemite National Park - July 7, 2022The Washburn Fire started July 7, 2022 in the southern part of Yosemite National Park. Landsats 8 and 9 both captured imagery of it a day later. The Landsat 9 image uses shortwave infrared and near-infrared bands to show the active burning.

Western Meadowlark
Image of a western meadowlark, a grassland-dwelling bird species. Credit: USFWS, public domain
Image of a western meadowlark, a grassland-dwelling bird species. Credit: USFWS, public domain

Map of the M 3.5 - 6 km E of Elgin, South Carolina on June 29,2022
Map of the M 3.5 - 6 km E of Elgin, South Carolina on June 29,2022A map showing the epicenter of the M 3.5 quake that occurred 3.7 miles (6 km) east of Elgin, South Carolina on June 29, 2022. The quake is part of an ongoing sequence in central South Carolina. The sequence started on December 27, 2021, with an M3.3 earthquake near Lugoff, South Carolina.

Montana trout fishing
Boaters fly fishing on the Missouri River in Montana
Boaters fly fishing on the Missouri River in Montana

Installing natural infrastructure can impact the water and carbon budgets of dryland streams and watersheds
Installing natural infrastructure can impact the water and carbon budgets of dryland streams and watershedsAn illustration of a mountain with water flowing from the top down to a river with smaller rivers flowing off the sides. Multiple items appear along the various rivers including leaky weirs, one rock dams, log dams, gabions, check dams, trincheras, and earthen berms. Informational bubbles appear alongside these various item in the illustration.

USGS scientists test new method for microplastics analysis
USGS scientists test new method for microplastics analysisUSGS hydrologists and hydrologic technicians test a new method for collecting water from the Millstone River in Blackwells Mills, New Jersey. The new method helps measure microplastics concentrations using representative cross-section sampling. In the background, USGS staff maneuver a stainless-steel pump and tubing at pre-determined points along the river.

Mendenhall Fellows Sabine Loos and Max Schneider
In June 2022, Mendenhall Fellow Sabine Loos (Research Civil Engineer in the Geological Hazards Science Center) presented a seminar to USGS's Earthquake Science Center at Moffett Field, CA, where Max Schneider (Research Statistician) works as a Mendenhall Fellow.
In June 2022, Mendenhall Fellow Sabine Loos (Research Civil Engineer in the Geological Hazards Science Center) presented a seminar to USGS's Earthquake Science Center at Moffett Field, CA, where Max Schneider (Research Statistician) works as a Mendenhall Fellow.

Map showing helicopter survey area and near Granby, Colo.
Map showing helicopter survey area and near Granby, Colo.Map showing helicopter survey area and near Granby, Colo. Surveys will not occur directly above populated areas. Black circle indicates study area.
Map showing helicopter survey area and near Granby, Colo.
Map showing helicopter survey area and near Granby, Colo.Map showing helicopter survey area and near Granby, Colo. Surveys will not occur directly above populated areas. Black circle indicates study area.

Collection Of Sediment And Water Sampling Prior To The Possible Occurrence Of Oil Contamination From The Deepwater Horizon Oil Well At Egmont Key, Florida
Collection Of Sediment And Water Sampling Prior To The Possible Occurrence Of Oil Contamination From The Deepwater Horizon Oil Well At Egmont Key, FloridaBruce Bernard (left) and Scott McBride (right) obtain water and sediment samples at Egmont Key which is about 1 mile west of the mouth of Tampa Bay in the Gulf of America. Samples were collected June 14, 2010 prior to the possible occurrence of oil contamination from the Deepwater Horizon's oil well.
Collection Of Sediment And Water Sampling Prior To The Possible Occurrence Of Oil Contamination From The Deepwater Horizon Oil Well At Egmont Key, Florida
Collection Of Sediment And Water Sampling Prior To The Possible Occurrence Of Oil Contamination From The Deepwater Horizon Oil Well At Egmont Key, FloridaCollection Of Sediment And Water Sampling Prior To The Possible Occurrence Of Oil Contamination From The Deepwater Horizon Oil Well At Egmont Key, Florida
Collection Of Sediment And Water Sampling Prior To The Possible Occurrence Of Oil Contamination From The Deepwater Horizon Oil Well At Egmont Key, FloridaBruce Bernard (left) and Scott McBride (right) obtain water and sediment samples at Egmont Key which is about 1 mile west of the mouth of Tampa Bay in the Gulf of America. Samples were collected June 14, 2010 prior to the possible occurrence of oil contamination from the Deepwater Horizon's oil well.


A simple esker in Iceland
A simple esker that was recently exposed near the ice margin in Iceland.
A simple esker that was recently exposed near the ice margin in Iceland.

A complex esker system in Iceland
Lauren Edgar, a research geologist with the USGS Astrogeology Science Center, setting up a Terrestrial Laser Scanner (ground-based LiDAR) to acquire detailed topographic information for a complex esker system. The Breiðamerkurjökull glacier is visible in the background.
Lauren Edgar, a research geologist with the USGS Astrogeology Science Center, setting up a Terrestrial Laser Scanner (ground-based LiDAR) to acquire detailed topographic information for a complex esker system. The Breiðamerkurjökull glacier is visible in the background.

Lauren Edgar uses a hand lens to identify minerals in a sample from a complex esker.
Lauren Edgar uses a hand lens to identify minerals in a sample from a complex esker.Lauren Edgar, a research geologist with the USGS Astrogeology Science Center, uses a hand lens to identify minerals in a sample from a complex esker in Iceland.
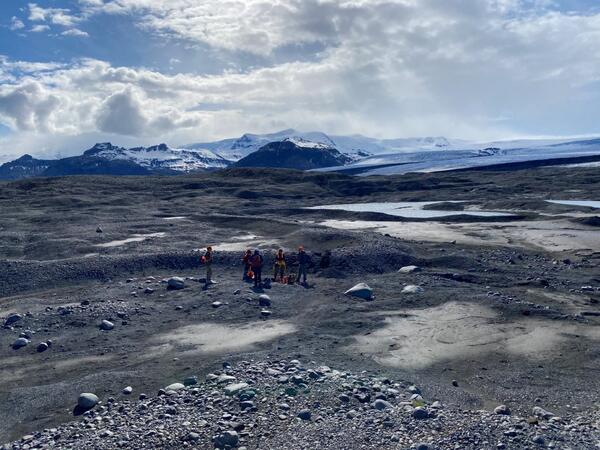
Researchers from the USGS, NASA, and NAU gather around a small simple esker and ephemeral lake deposits.
Researchers from the USGS, NASA, and NAU gather around a small simple esker and ephemeral lake deposits.Researchers from the USGS, NASA, and NAU gather around a small simple esker and ephemeral lake deposits. The team used sedimentology, geochemistry, and remote sensing to characterize these features on Earth before comparing them to Mars.

MTLLFareamap.JPG
Survey area for low-flying helicopter soon to be visible in six Montana counties, including Helena, the Elkhorn Mountains, Bull Mountain and the Tobacco Root Mountains.
Survey area for low-flying helicopter soon to be visible in six Montana counties, including Helena, the Elkhorn Mountains, Bull Mountain and the Tobacco Root Mountains.

Group photo 2 by Matt Burgess NUSO_Cropped.jpg
In this photo, a group of 20 scientists pose for the camera. The group is dressed in winter gear and stands in front of Berthoud Pass, Colorado. The pass and the ground are covered in snow. Berthoud Pass has a few patches of dark green trees.
In this photo, a group of 20 scientists pose for the camera. The group is dressed in winter gear and stands in front of Berthoud Pass, Colorado. The pass and the ground are covered in snow. Berthoud Pass has a few patches of dark green trees.

Snow to Flow.png
In order to get accurate measurements, the Snow to Flow scientists collect several kinds of data using a few different tools. Evan and the team dig snowpits and collect snow depth, snow density, and weather data. They also place sensors across the snowpack to help the drones collect accurate data.
In order to get accurate measurements, the Snow to Flow scientists collect several kinds of data using a few different tools. Evan and the team dig snowpits and collect snow depth, snow density, and weather data. They also place sensors across the snowpack to help the drones collect accurate data.