Debris flow in Glenwood Canyon during the summer of 2021
Debris flow in Glenwood Canyon during the summer of 2021Debris flow in Glenwood Canyon during the summer of 2021. This event followed the 2020 Grizzly Creek Fire in Glenwood Canyon, Colorado.

Official websites use .gov
A .gov website belongs to an official government organization in the United States.
Secure .gov websites use HTTPS
A lock () or https:// means you’ve safely connected to the .gov website. Share sensitive information only on official, secure websites.
Images

Debris flow in Glenwood Canyon during the summer of 2021. This event followed the 2020 Grizzly Creek Fire in Glenwood Canyon, Colorado.
Debris flow in Glenwood Canyon during the summer of 2021. This event followed the 2020 Grizzly Creek Fire in Glenwood Canyon, Colorado.

Interstate 70 in Glenwood Canyon, Colorado. In the summer of 2021, travelers in Colorado's Glenwood Canyon were safely evacuated before massive debris flows buried highways and destroyed bridges, thanks to a debris flow warning system developed in part by the U.S. Geological Survey.
Interstate 70 in Glenwood Canyon, Colorado. In the summer of 2021, travelers in Colorado's Glenwood Canyon were safely evacuated before massive debris flows buried highways and destroyed bridges, thanks to a debris flow warning system developed in part by the U.S. Geological Survey.

USGS scientist assesses debris flow in Glenwood Canyon, Colorado. This post-wildfire debris flow follows the 2020 Grizzly Creek Fire.
USGS scientist assesses debris flow in Glenwood Canyon, Colorado. This post-wildfire debris flow follows the 2020 Grizzly Creek Fire.

Figure 2.

Figure 1. Chance of minor or greater damaging earthquake shaking in the next 100 years. Population exposure estimates are rounded to the nearest 1000.
Figure 1. Chance of minor or greater damaging earthquake shaking in the next 100 years. Population exposure estimates are rounded to the nearest 1000.

Seismicity of Hawaii: earthquakes M>5 from the 1840-1899, 1900-1959, 1960-2019 catalogs shown separately. While earthquake activity remains high today, it seems to have decreased over the past 60 years, which could be related to less volcanic activity at Mauna Loa.
Seismicity of Hawaii: earthquakes M>5 from the 1840-1899, 1900-1959, 1960-2019 catalogs shown separately. While earthquake activity remains high today, it seems to have decreased over the past 60 years, which could be related to less volcanic activity at Mauna Loa.
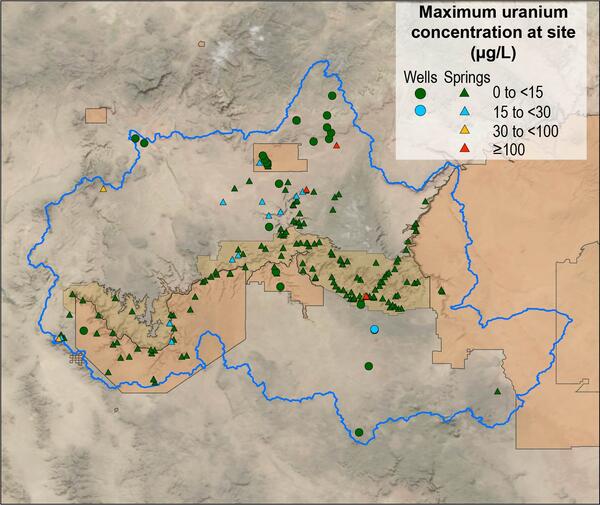
Map of maximum uranium concentration at 206 spring and well sites in the Grand Canyon region.
Map of maximum uranium concentration at 206 spring and well sites in the Grand Canyon region.

Triple-high mist net in front of Half Dome. The net is used to capture bats as part of a study tracking bat movements in Yosemite National Park.
Triple-high mist net in front of Half Dome. The net is used to capture bats as part of a study tracking bat movements in Yosemite National Park.

Photo of the drone performing a low-altitude gas survey to monitor gas emissions near Mammoth Lakes, CA. In the foreground (the white outcrops) is a fumarole. The dead trees in the background are due to tree-kill from heated ground temperatures
Photo of the drone performing a low-altitude gas survey to monitor gas emissions near Mammoth Lakes, CA. In the foreground (the white outcrops) is a fumarole. The dead trees in the background are due to tree-kill from heated ground temperatures

Landsat image of Window Rock, Arizona, acquired on November 3, 2021.
For more information about Landsat, please visit www.usgs.gov/Landsat
To download the data, visit earthexplorer.usgs.gov
Landsat image of Window Rock, Arizona, acquired on November 3, 2021.
For more information about Landsat, please visit www.usgs.gov/Landsat
To download the data, visit earthexplorer.usgs.gov

Landsat 9 is the latest in a prestigious line of satellites that have been watching our planet for nearly 50 years. They have monitored changes on land and made that information freely available to users around the world.
Landsat 9 is the latest in a prestigious line of satellites that have been watching our planet for nearly 50 years. They have monitored changes on land and made that information freely available to users around the world.

To adapt to rising sea levels, coastal wetlands can migrate landward at the expense of adjacent freshwater wetlands and upland ecosystems, but migration can be hindered by natural and anthropogenic barriers. This photo shows marsh migration constrained by topographic and urban barriers in southern California.
To adapt to rising sea levels, coastal wetlands can migrate landward at the expense of adjacent freshwater wetlands and upland ecosystems, but migration can be hindered by natural and anthropogenic barriers. This photo shows marsh migration constrained by topographic and urban barriers in southern California.
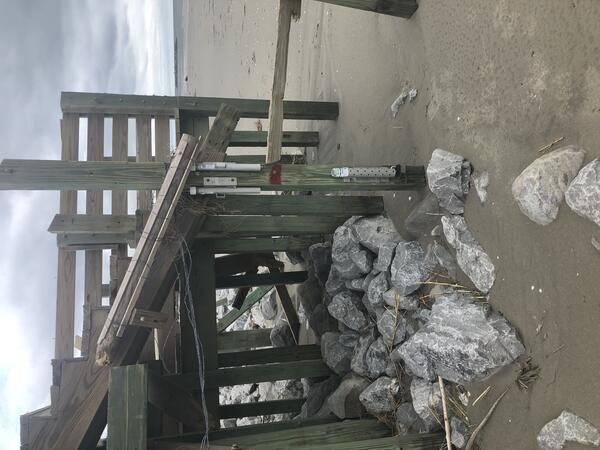
USGS storm tide sensor installed on a beach access pier in Grand Isle, Louisiana, for Hurricane Ida in 2021. The highest wave documented by this sensor during the hurricane was 13.48 feet on August 29.
USGS storm tide sensor installed on a beach access pier in Grand Isle, Louisiana, for Hurricane Ida in 2021. The highest wave documented by this sensor during the hurricane was 13.48 feet on August 29.
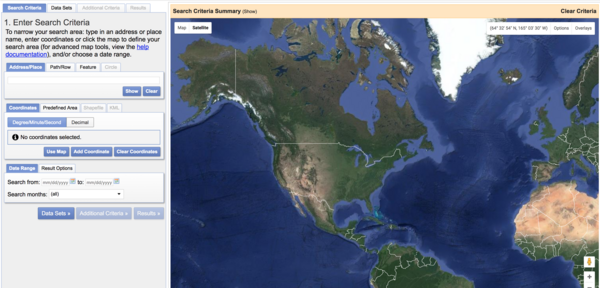
The EarthExplorer (EE) user interface is an online search, discovery, and ordering tool developed by the United States Geological Survey (USGS). EE supports the searching of satellite, aircraft, and other remote sensing inventories through interactive and textual-based query capabilities.
The EarthExplorer (EE) user interface is an online search, discovery, and ordering tool developed by the United States Geological Survey (USGS). EE supports the searching of satellite, aircraft, and other remote sensing inventories through interactive and textual-based query capabilities.

USGS gaging station on the Kenduskeag Stream near Bangor, Maine, station 01037000. This station is downstream of Six Mile Falls, a popular spot during the Kenduskeag Canoe Race.
USGS gaging station on the Kenduskeag Stream near Bangor, Maine, station 01037000. This station is downstream of Six Mile Falls, a popular spot during the Kenduskeag Canoe Race.

Landsat's thermal and infrared bands also expose the Caldor fire's advancing edge at night time. This image is from August 29, 201, 15 days after ignition.
Landsat's thermal and infrared bands also expose the Caldor fire's advancing edge at night time. This image is from August 29, 201, 15 days after ignition.

Photo looking downstream from the Pack Creek Road Bridge shows the rain gage on top with a USGS sticker. Below is a solar panel for power. The other white round object contains the data logger and satellite antenna.
Photo looking downstream from the Pack Creek Road Bridge shows the rain gage on top with a USGS sticker. Below is a solar panel for power. The other white round object contains the data logger and satellite antenna.

The Caldor Fire in California started on August 14, 2021 and quickly spread in high winds. The fire expanded toward the Lake Tahoe area as residents evacuated. Landsat image was captured on August 21, the 8th day. Landsat 8's near-infrared and shortwave infrared bands reveal active fire, burn scars, and smoke.
The Caldor Fire in California started on August 14, 2021 and quickly spread in high winds. The fire expanded toward the Lake Tahoe area as residents evacuated. Landsat image was captured on August 21, the 8th day. Landsat 8's near-infrared and shortwave infrared bands reveal active fire, burn scars, and smoke.

USGS infographic on the magnitude 5.8 earthquake that struck central Virginia August 23, 2011, east coast earthquake hazards and how the USGS is helping inform critical decisions to protect lives and property.
Full Text Description:
10-YEAR ANNIVERSARY OF THE M5.8 EARTHQUAKE IN VIRGINIA
America’s Most Widely Felt Earthquake

Dixie Fire The Dixie Fire has become the largest single fire in California's recorded history. State fire officials don't list it at the top, however. The record is held by the massive August Complex Fire of 2020 which burned over one million acres. The term "complex" is used when multiple fires in the same area ignite separately.
Dixie Fire The Dixie Fire has become the largest single fire in California's recorded history. State fire officials don't list it at the top, however. The record is held by the massive August Complex Fire of 2020 which burned over one million acres. The term "complex" is used when multiple fires in the same area ignite separately.

A Columbia spotted frog (Rana luteiventris) collected for methylmercury sampling in Montana.
A Columbia spotted frog (Rana luteiventris) collected for methylmercury sampling in Montana.