
A comparison of low, medium (default), and high contour smoothing options available from the topoBuilder application.
Images
Images
Filter Total Items: 9454

topoBuilder Infographic Smoothing Options
A comparison of low, medium (default), and high contour smoothing options available from the topoBuilder application.

Horseshoe Bend Topographic Map from topoBuilder
A topographic map of Horseshoe Bend, part of the Grand Canyon in Arizona, made with topoBuilder. Custom topographic maps like this one can be made using topoBuilder.
A topographic map of Horseshoe Bend, part of the Grand Canyon in Arizona, made with topoBuilder. Custom topographic maps like this one can be made using topoBuilder.

Movement of a Lesser Scaup Infected with Highly Pathogenic Avian Influenza
Movement of a Lesser Scaup Infected with Highly Pathogenic Avian InfluenzaUSGS map showing the movement of a lesser scaup infected with highly pathogenic avian influenza (red line) compared to four lesser scaup not infected (maroon, yellow, blue and black lines). Movement was recorded January 23 to 26, 2022. The black dot identifies where the birds were captured and released in Maryland.

Jeff Pigati collecting pollen at White Sands site
USGS scientist Jeff Pigati collects pollen for radiocarbon dating at the site where human footprints were found in order to estimate the age of the footprints. Pollen also provides a picture of what kind of vegetation existed at the time that the footprints were made.
USGS scientist Jeff Pigati collects pollen for radiocarbon dating at the site where human footprints were found in order to estimate the age of the footprints. Pollen also provides a picture of what kind of vegetation existed at the time that the footprints were made.

River sediments filling the bottom of Lake Powell
Cartoon GIF cross-section of river sediments filling the bottom of Lake Powell from pre-Glen Canyon dam to today.
Cartoon GIF cross-section of river sediments filling the bottom of Lake Powell from pre-Glen Canyon dam to today.
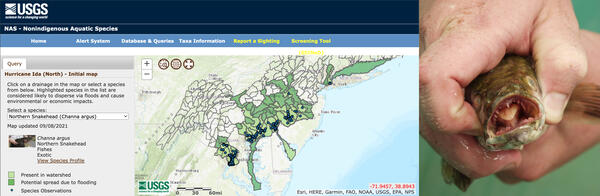
Flood and Storm Tracker map of Northern Snakeheads
Flood and Storm Tracker map of Northern Snakeheads(Left) This Flood and Storm Tracker map shows areas where flooding caused by Hurricane Ida in 2021 may have spread the invasive northern snakehead. (Right) The northern snakehead is just one of almost 1,400 nonindigenous aquatic species the USGS can estimate the spread of after major flood events with these maps. USGS images.
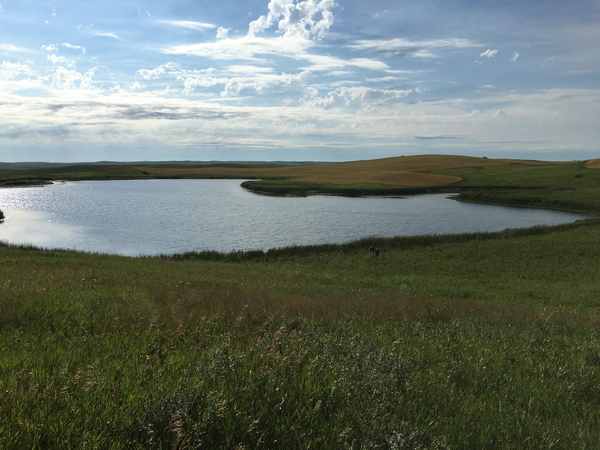
Prairie Pothole Wetland
A photo of a prairie pothole wetland. The Prairie Pothole Region is the largest wetland complex in North America.
A photo of a prairie pothole wetland. The Prairie Pothole Region is the largest wetland complex in North America.

Vehicles drive on Interstate 70 in Glenwood Canyon, Colorado
Vehicles drive on Interstate 70 in Glenwood Canyon, ColoradoVehicles drive on interstate I-70 in Glenwood Canyon, Colorado. In the summer of 2021, travelers in Colorado's Glenwood Canyon were safely evacuated before massive debris flows buried highways and destroyed bridges, thanks to a debris flow warning system developed in part by the U.S. Geological Survey.

National Land Cover Database of the Cape Cod Region
National Land Cover Database of the Cape Cod RegionThis map of the Cape Cod region is created with the National Land Cover Dataset (NLCD). The dataset classifies land cover into categories such as developed areas, forests, wetlands, and water bodies, providing a detailed view of the region's composition.

Male and female bighorn sheep
Male (ram - left) and female (ewe) bighorn sheep outside of Yellowstone National Park.
Male (ram - left) and female (ewe) bighorn sheep outside of Yellowstone National Park.

Damage from 2021 Glenwood Canyon Debris Flow
The Grizzly Creek Fire initiated in August 2020, and widespread destructive debris flow activity followed the during the summer of 2021. This image shows damage from the summer 2021 debris flow in Glenwood Canyon, Colorado.
The Grizzly Creek Fire initiated in August 2020, and widespread destructive debris flow activity followed the during the summer of 2021. This image shows damage from the summer 2021 debris flow in Glenwood Canyon, Colorado.
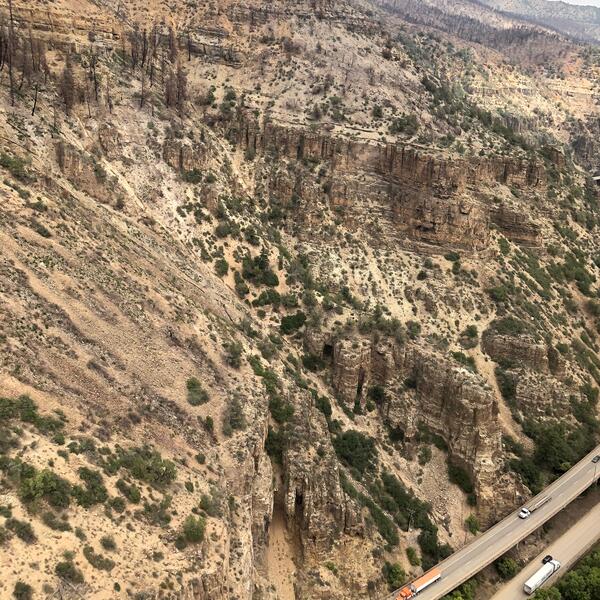
Interstate 70 through Glenwood Canyon, Colorado
Interstate 70 through Glenwood Canyon, Colorado. In the summer of 2021, travelers in Colorado's Glenwood Canyon were safely evacuated before massive mounds of mud and rocks buried highways and destroyed bridges, thanks to a debris flow warning system developed in part by the USGS.
Interstate 70 through Glenwood Canyon, Colorado. In the summer of 2021, travelers in Colorado's Glenwood Canyon were safely evacuated before massive mounds of mud and rocks buried highways and destroyed bridges, thanks to a debris flow warning system developed in part by the USGS.

Miel Corbett
Miel Corbett, Chief of Western States Office of Communications and Publishing. Leads public affairs team and activities in the Western United States.
Miel Corbett, Chief of Western States Office of Communications and Publishing. Leads public affairs team and activities in the Western United States.
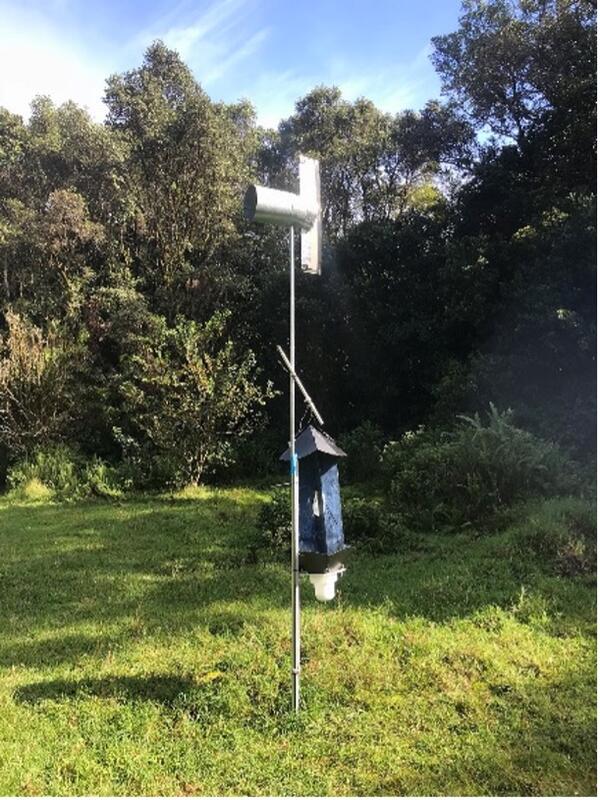
aerial spore trap
USGS scientists designed a low-cost, easy-to-build method of sampling the air for eDNA. Photo by Kylle Roy, USGS
USGS scientists designed a low-cost, easy-to-build method of sampling the air for eDNA. Photo by Kylle Roy, USGS
A robotic sampler
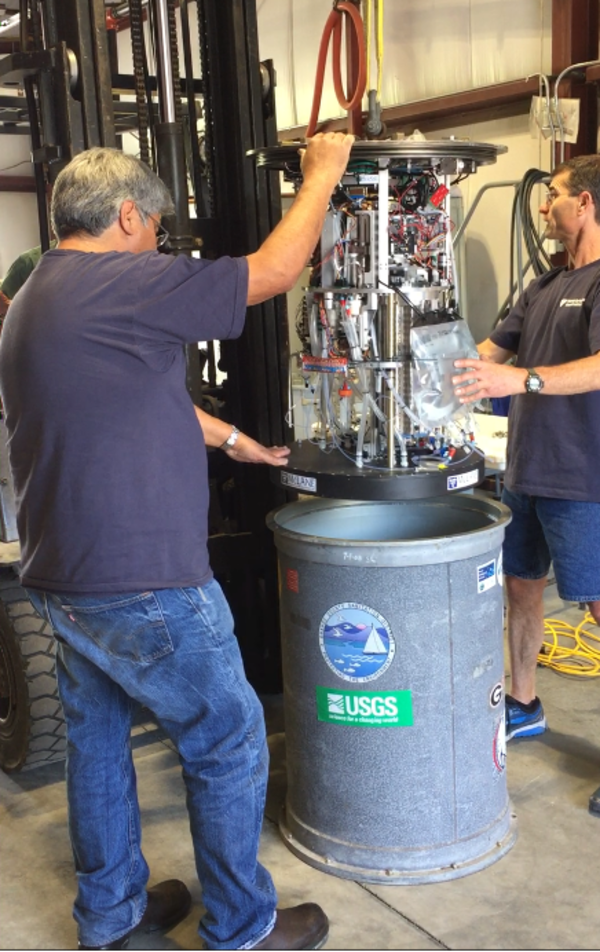
The Monterey Bay Aquarium Research Institute robotic sampler is shown being lowered into its metal housing. Photo by Cheryl Miller, USGS
The Monterey Bay Aquarium Research Institute robotic sampler is shown being lowered into its metal housing. Photo by Cheryl Miller, USGS

Argentine black and white tegus can survive the winter
Argentine black and white tegus can survive the winterArgentine black and white tegus (Salvator merianae) can survive the winter under semi-natural conditions well beyond their current invasive range.
Argentine black and white tegus can survive the winter
Argentine black and white tegus can survive the winterArgentine black and white tegus (Salvator merianae) can survive the winter under semi-natural conditions well beyond their current invasive range.

Landsat 9 - An Artist Rendition in Orbit
An artist’s rendition of Landsat 9 in orbit.
Source: NASA, public domain.
An artist’s rendition of Landsat 9 in orbit.
Source: NASA, public domain.

Golden Eagle soaring near a wind turbine tower in the Altamont Pass Wind Resource Area, California
Golden Eagle soaring near a wind turbine tower in the Altamont Pass Wind Resource Area, CaliforniaTargeted monitoring of Golden Eagle populations is an integral component of effective management, serving as a guide for deciding the appropriate course of management action, evaluating the effectiveness of such actions, and providing options to better achieve management goals.

Debris flow in Glenwood Canyon during the summer of 2021
Debris flow in Glenwood Canyon during the summer of 2021Debris flow in Glenwood Canyon during the summer of 2021. This event followed the 2020 Grizzly Creek Fire in Glenwood Canyon, Colorado.
Debris flow in Glenwood Canyon during the summer of 2021
Debris flow in Glenwood Canyon during the summer of 2021Debris flow in Glenwood Canyon during the summer of 2021. This event followed the 2020 Grizzly Creek Fire in Glenwood Canyon, Colorado.

Interstate 70 in Glenwood Canyon, Colorado
Interstate 70 in Glenwood Canyon, Colorado. In the summer of 2021, travelers in Colorado's Glenwood Canyon were safely evacuated before massive debris flows buried highways and destroyed bridges, thanks to a debris flow warning system developed in part by the U.S. Geological Survey.
Interstate 70 in Glenwood Canyon, Colorado. In the summer of 2021, travelers in Colorado's Glenwood Canyon were safely evacuated before massive debris flows buried highways and destroyed bridges, thanks to a debris flow warning system developed in part by the U.S. Geological Survey.

Scientist assesses debris flow in Glenwood Canyon
USGS scientist assesses debris flow in Glenwood Canyon, Colorado. This post-wildfire debris flow follows the 2020 Grizzly Creek Fire.
USGS scientist assesses debris flow in Glenwood Canyon, Colorado. This post-wildfire debris flow follows the 2020 Grizzly Creek Fire.