
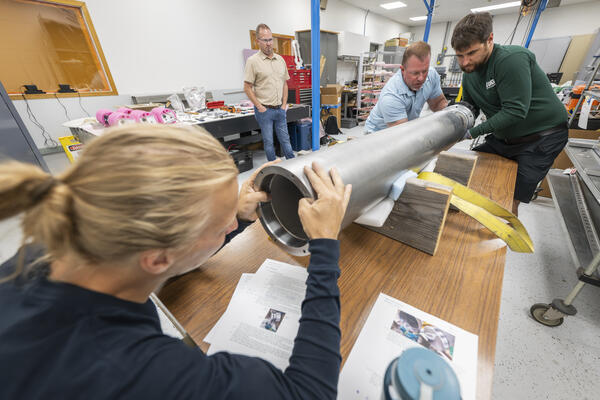
Nicholas Pelyk, Jason Patton, Rob Anthony, and Skyler Grulke slide a part into the tube while assembling a seismometer at the Physical Sciences Laboratory in Stoughton, Wisconsin on Aug. 7, 2025. (Photo by Taylor Wolfram / UW–Madison)
Images
Images related to natural hazards.
Filter Total Items: 7275
IceCube 2025-08-07TW 1279
Nicholas Pelyk, Jason Patton, Rob Anthony, and Skyler Grulke slide a part into the tube while assembling a seismometer at the Physical Sciences Laboratory in Stoughton, Wisconsin on Aug. 7, 2025. (Photo by Taylor Wolfram / UW–Madison)
IceCube 2025-08-07TW 0407
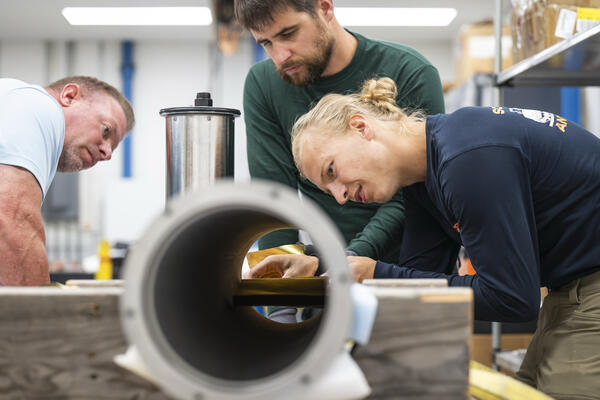
Jason Patton, Rob Anthony (USGS), and Skyler Grulke assemble a seismometer at the Physical Sciences Laboratory in Stoughton, Wisconsin on Aug. 7, 2025. (Photo by Taylor Wolfram / UW–Madison)
Jason Patton, Rob Anthony (USGS), and Skyler Grulke assemble a seismometer at the Physical Sciences Laboratory in Stoughton, Wisconsin on Aug. 7, 2025. (Photo by Taylor Wolfram / UW–Madison)

ENS icon
This is an icon used for the Earthquake Notification Service product as illustrated on the Earthquake Hazards Program products page.
This is an icon used for the Earthquake Notification Service product as illustrated on the Earthquake Hazards Program products page.
Ground Failure icon
This is an icon used for the Ground Failure product as illustrated on the Earthquake Hazards Program products page.
This is an icon used for the Ground Failure product as illustrated on the Earthquake Hazards Program products page.

PAGER icon
This is an icon used for the PAGER product as illustrated on the Earthquake Hazards Program products page.
This is an icon used for the PAGER product as illustrated on the Earthquake Hazards Program products page.
Finite fault icon
This is an icon used for the Finite Fault product as illustrated on the Earthquake Hazards Program products page.
This is an icon used for the Finite Fault product as illustrated on the Earthquake Hazards Program products page.
ShakeMap icon
This is an icon used for the ShakeMap product as illustrated on the Earthquake Hazards Program products page.
This is an icon used for the ShakeMap product as illustrated on the Earthquake Hazards Program products page.
Earthquake Scenarios icon
This is an icon used for the Earthquake Scenarios product as illustrated on the Earthquake Hazards Program products page.
This is an icon used for the Earthquake Scenarios product as illustrated on the Earthquake Hazards Program products page.

Moment tensor icon
This is an icon used for the Moment Tensors product as illustrated on the Earthquake Hazards Program products page.
This is an icon used for the Moment Tensors product as illustrated on the Earthquake Hazards Program products page.

ShakeAlert icon
This is an icon used for the ShakeAlert product as illustrated on the Earthquake Hazards Program products page.
This is an icon used for the ShakeAlert product as illustrated on the Earthquake Hazards Program products page.
ShakeCast icon
This is an icon used for the ShakeCast product as illustrated on the Earthquake Hazards Program products page.
This is an icon used for the ShakeCast product as illustrated on the Earthquake Hazards Program products page.
Earthquake magnitudes and numbers over time during July 8 - August 25, 2025, Mount Rainier earthquake swarm
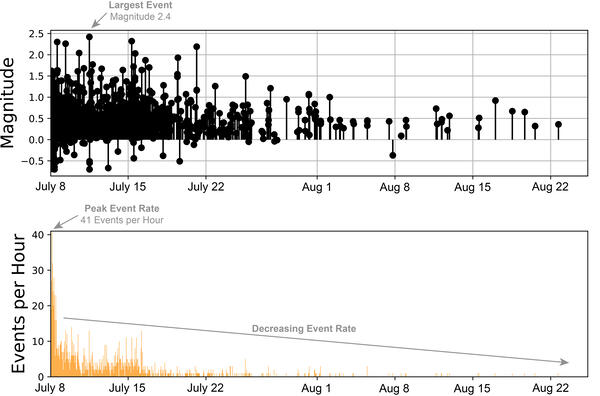
Earthquake magnitudes and numbers over time during July 8 - August 25, 2025, Mount Rainier earthquake swarmPlots of earthquake magnitudes (top) and numbers (bottom) over the course of the July 8 - August 25, 2025 seismic swarm at Mount Rainier, Washington. The swarm was greatest in terms of numbers of events on the morning of July 8. After that time, earthquake rates slowly decreased over the course of the following days.
Earthquake magnitudes and numbers over time during July 8 - August 25, 2025, Mount Rainier earthquake swarm
Earthquake magnitudes and numbers over time during July 8 - August 25, 2025, Mount Rainier earthquake swarmPlots of earthquake magnitudes (top) and numbers (bottom) over the course of the July 8 - August 25, 2025 seismic swarm at Mount Rainier, Washington. The swarm was greatest in terms of numbers of events on the morning of July 8. After that time, earthquake rates slowly decreased over the course of the following days.

cir1555_fig04.png
Map of the United States and its territories showing the distribution of average annualized earthquake losses by region (modified from Jaiswal and others, 2023). Economic losses from earthquakes in these nine regions are estimated to average \$14.7 billion dollars per year.
Map of the United States and its territories showing the distribution of average annualized earthquake losses by region (modified from Jaiswal and others, 2023). Economic losses from earthquakes in these nine regions are estimated to average \$14.7 billion dollars per year.

cir1555_fig02.png
Map of the United States and its territories showing 2024 International Building Code Seismic Design Categories and Risk Categories.
Map of the United States and its territories showing 2024 International Building Code Seismic Design Categories and Risk Categories.

SOLAR CYCLES AND INCREASED SUNSPOT ACTIVITY
The graphic shows the last 17 solar cycles and their related increased sunspot activity. A solar cycle is a roughly 11-year periodic change in the Sun characterized by variations in the number and intensity of sunspots, as well as a flipping of its magnetic poles.
The graphic shows the last 17 solar cycles and their related increased sunspot activity. A solar cycle is a roughly 11-year periodic change in the Sun characterized by variations in the number and intensity of sunspots, as well as a flipping of its magnetic poles.

AftershockForecastfig6.gif
An example of Bayesian updating of productivity parameter (a-value) for the 2010 Mw 8.8 Maule, Chile, earthquake. Immediately following the earthquake, the SZ-GENERIC region-specific a-value distribution can be used.
An example of Bayesian updating of productivity parameter (a-value) for the 2010 Mw 8.8 Maule, Chile, earthquake. Immediately following the earthquake, the SZ-GENERIC region-specific a-value distribution can be used.

Mendocino_headerinfo-2.jpg
Screenshot of the Aftershock Forecast for an earthquake in California, showing the information box at the top of the forecast and the four tabs of forecast information.
Screenshot of the Aftershock Forecast for an earthquake in California, showing the information box at the top of the forecast and the four tabs of forecast information.
AftershockForecastSequence-SpecificModelParameters.png
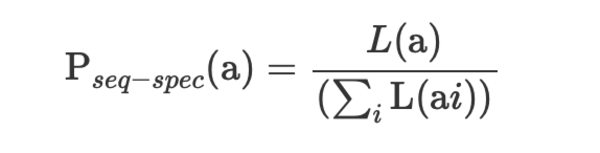
AftershockForecastSequence-SpecificModelParameters.pngAftershock Forecast Sequence-Specific Model Parameters equation
The probability distribution for the number of aftershocks, P(N), and the forecast can then be computed using the same procedures as for the generic model, using Pseq-spec(a) instead of Pgeneric(a).
AftershockForecastSequence-SpecificModelParameters.png
AftershockForecastSequence-SpecificModelParameters.pngAftershock Forecast Sequence-Specific Model Parameters equation
The probability distribution for the number of aftershocks, P(N), and the forecast can then be computed using the same procedures as for the generic model, using Pseq-spec(a) instead of Pgeneric(a).

AftershockEquation2Screenshot.png
Equation 2 for the Aftershock Forecast probability distribution to compute the forecast
Equation 2 for the Aftershock Forecast probability distribution to compute the forecast

March 14, 2025 — Kīlauea summit eruption overflight with Mauna Loa in the background
March 14, 2025 — Kīlauea summit eruption overflight with Mauna Loa in the backgroundA low-angle aerial view of the vents where episodic fountaining has been occurring since the start of the ongoing Kīlauea summit eruption on December 23, 2024. A white plume of volcanic gas rises from the north vent (center right) and south vent (center left) cones in the southwest corner of Halema‘uma‘u crater, as viewed during a monitoring overflight.

ShakeMap icon
Icon used to refer to ShakeMap on Product landing pages. For example use, see https://staging-earthquake.usgs.gov/data/pager/background.php.
Icon used to refer to ShakeMap on Product landing pages. For example use, see https://staging-earthquake.usgs.gov/data/pager/background.php.