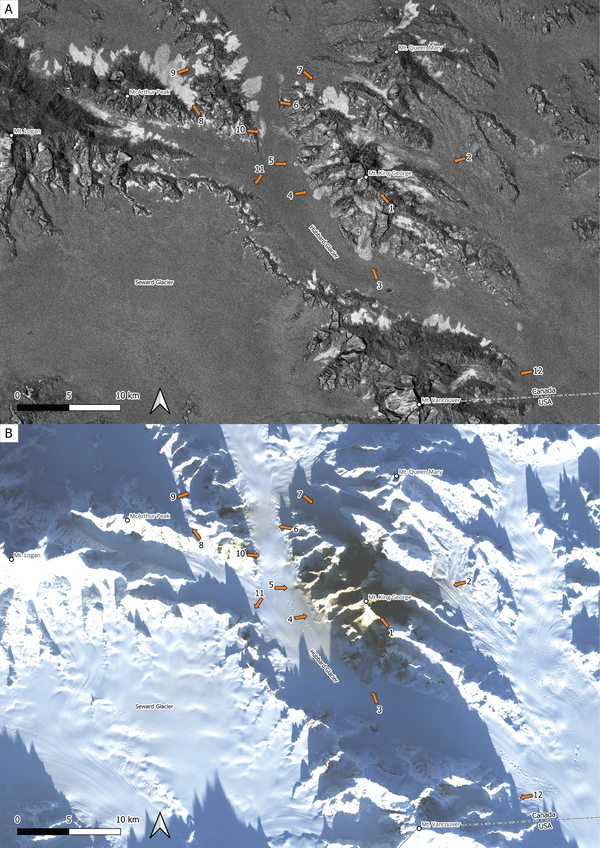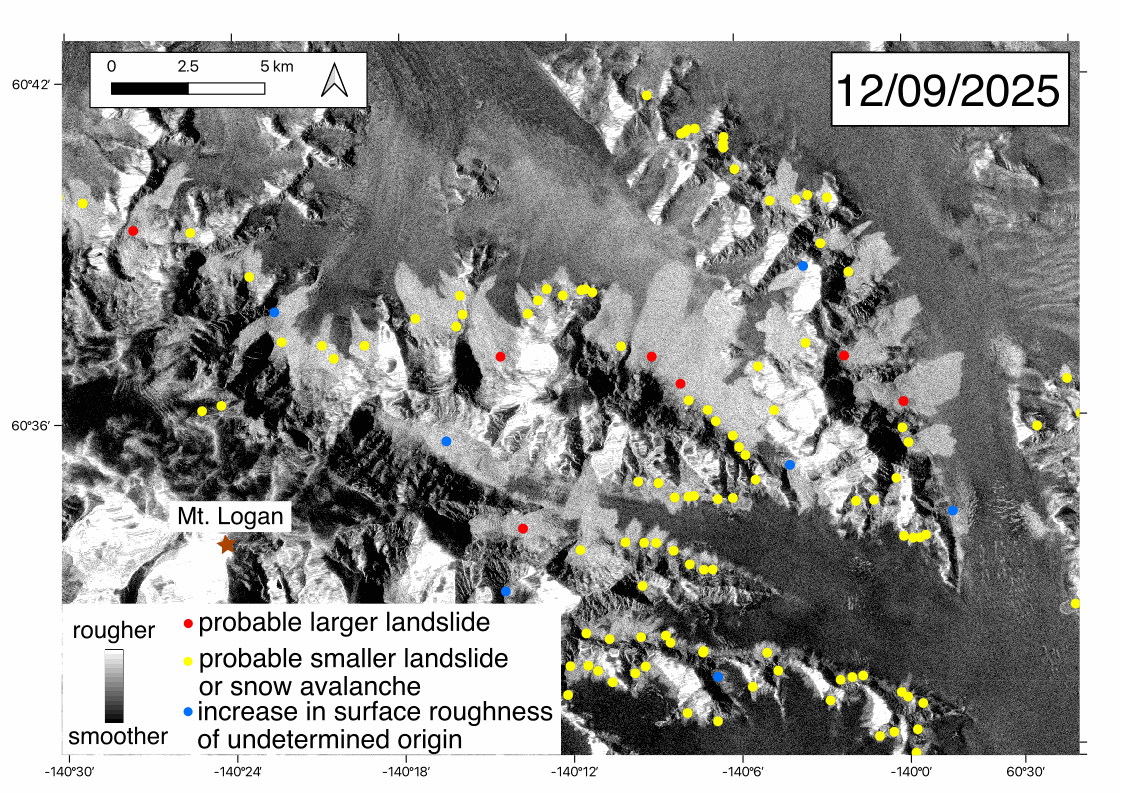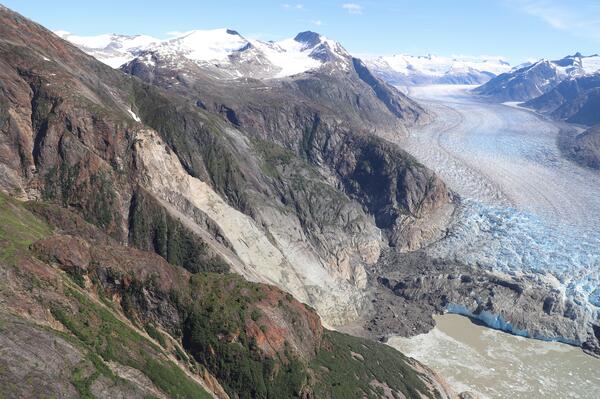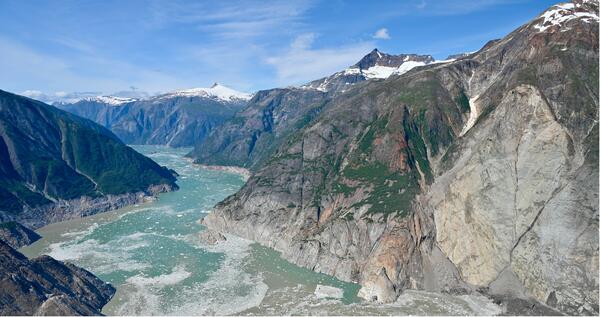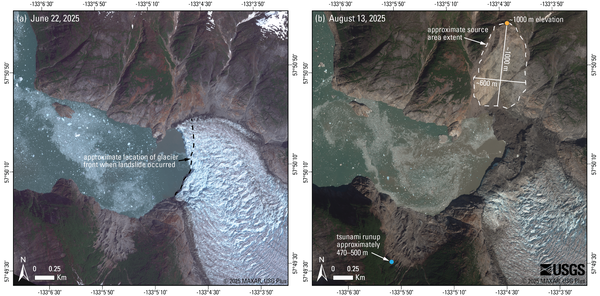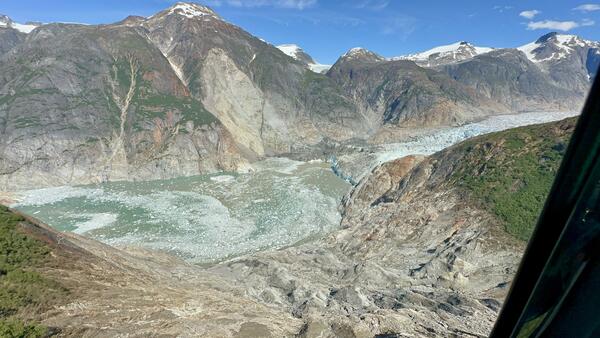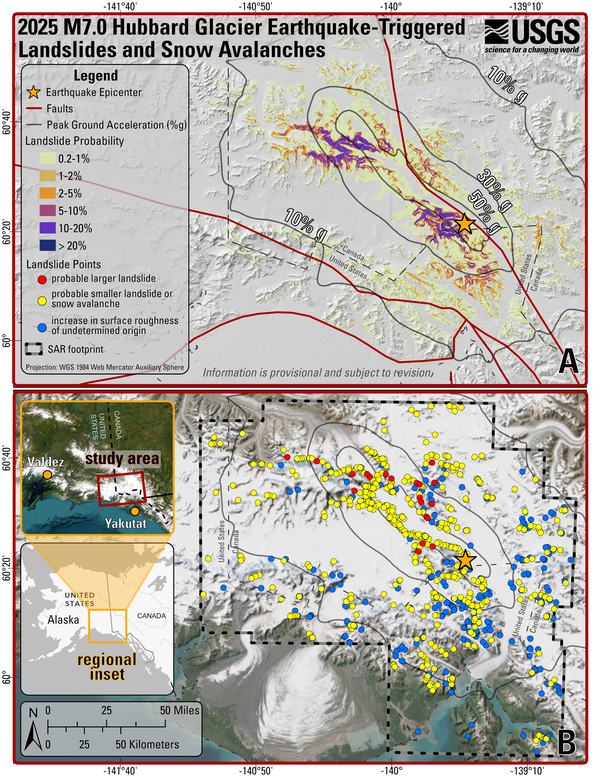
2025 M7.0 Hubbard Glacier Earthquake-Triggered Landslides and Snow Avalanches Overview Map
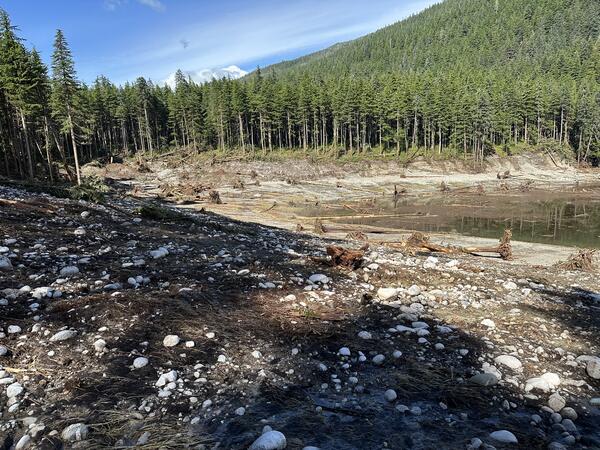
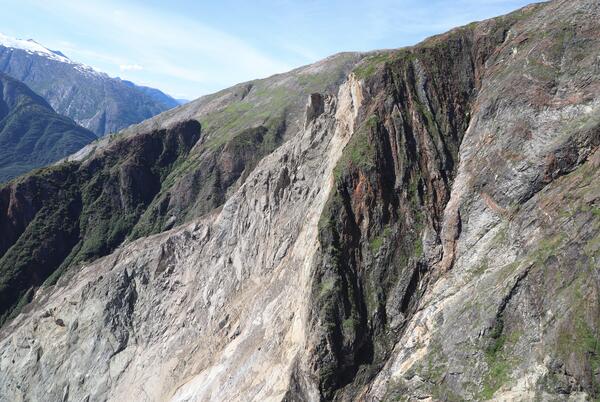
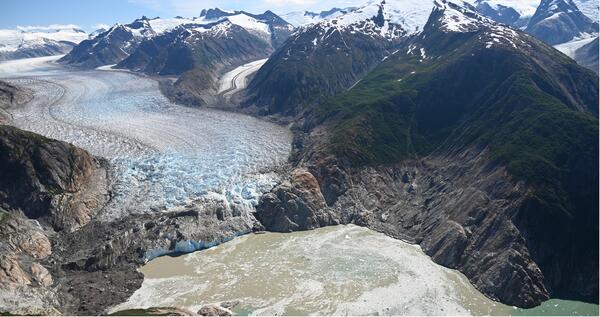
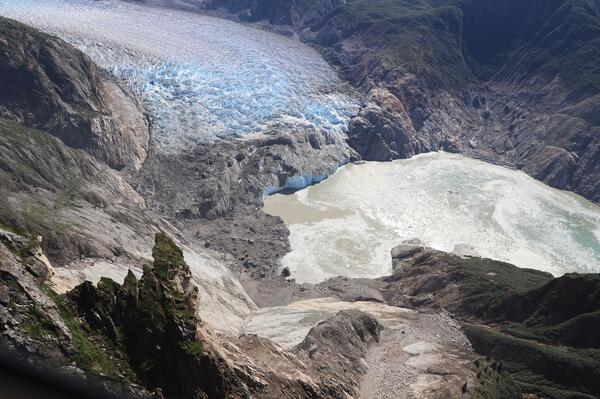
2025 M7.0 Hubbard Glacier Earthquake-Triggered Landslides and Snow Avalanches Overview MapOverview maps at the same scale showing the epicenter of the M7.0 Hubbard Glacier Earthquake and modeled peak ground acceleration contours. A) shows the probability of landslides triggered by the earthquake and mapped faults, and B) shows the locations of landslides mapped using synthetic aperture radar (SAR) change detection.