
Coloring page for geoscience careers. This page highlights those who want to become a geodesist.
Images
Images related to natural hazards.
Filter Total Items: 7275

I Am A...Geodesist
Coloring page for geoscience careers. This page highlights those who want to become a geodesist.

I Am A...Geographer
Coloring page for geoscience careers. This page highlights those who want to become a geographer.
Coloring page for geoscience careers. This page highlights those who want to become a geographer.
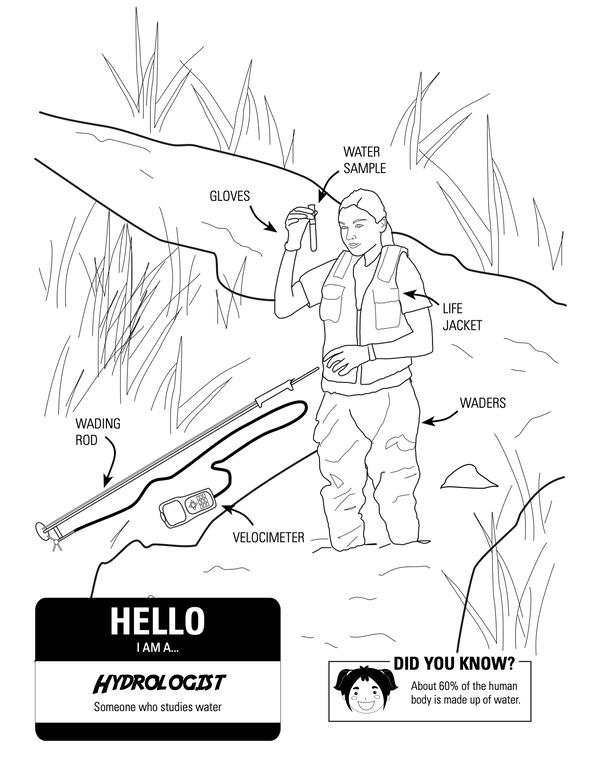
I Am A...Hydrologist
Coloring page for geoscience careers. This page highlights those who want to become a hydrologist.
Coloring page for geoscience careers. This page highlights those who want to become a hydrologist.

A landslide near Vilas, NC. - 10/13/2024
Coordinates of photographer: Latitude: 36° 15’ 31.74” N Longitude: 81° 44’ 32.952” W
Date 10/13/24
Caption: A landslide near Vilas, NC.
Taken as part of Hurricane Helene LASER response
Coordinates of photographer: Latitude: 36° 15’ 31.74” N Longitude: 81° 44’ 32.952” W
Date 10/13/24
Caption: A landslide near Vilas, NC.
Taken as part of Hurricane Helene LASER response

Multiple landslides and mudflows in Bat Cave, NC. - 10/13/2024
Multiple landslides and mudflows in Bat Cave, NC. - 10/13/2024Coordinates of photographer: Latitude: 35° 27’ 42.48” N Longitude: 82° 16’ 57.75” W
Date: 10/13/24
Caption: Multiple landslides and mudflows in Bat Cave, NC
Taken during Hurricane Helene LASER response

Landslide and flood damage near Zionville, NC. - 10/13/2024
Landslide and flood damage near Zionville, NC. - 10/13/2024Coordinates of photographer: Latitude: 36° 19’ 56.508” N Longitude: 81° 44’ 56.148” W
Date: 10/13/24
Caption: Landslide and flood damage near Zionville, NC.
Taken during Hurricane Helene LASER response

Page 7 of fictional Great ShakeOut instruction manual
Page 7 of fictional Great ShakeOut instruction manual[Page 7]
Did you feel that? The annual Great ShakeOut Earthquake Drill is coming on Thursday, Oct. 17, 2024, at 10:17 a.m. (local time, wherever you are). We never know where or when an earthquake may happen, but preparing is easier than assembling a piece of Scandinavian furniture.

Page 3 of fictional Great ShakeOut instruction manual
Page 3 of fictional Great ShakeOut instruction manual[Page 3]
Did you feel that? The annual Great ShakeOut Earthquake Drill is coming on Thursday, Oct. 17, 2024, at 10:17 a.m. (local time, wherever you are). We never know where or when an earthquake may happen, but preparing is easier than assembling a piece of Scandinavian furniture.

Page 4 of fictional Great ShakeOut instruction manual
Page 4 of fictional Great ShakeOut instruction manual[Page 4]
Did you feel that? The annual Great ShakeOut Earthquake Drill is coming on Thursday, Oct. 17, 2024, at 10:17 a.m. (local time, wherever you are). We never know where or when an earthquake may happen, but preparing is easier than assembling a piece of Scandinavian furniture.

Page 8 of fictional Great ShakeOut instruction manual
Page 8 of fictional Great ShakeOut instruction manual[Page 8]
Did you feel that? The annual Great ShakeOut Earthquake Drill is coming on Thursday, Oct. 17, 2024, at 10:17 a.m. (local time, wherever you are). We never know where or when an earthquake may happen, but preparing is easier than assembling a piece of Scandinavian furniture.

Page 5 of fictional Great ShakeOut instruction manual
Page 5 of fictional Great ShakeOut instruction manual[Page 5]
Did you feel that? The annual Great ShakeOut Earthquake Drill is coming on Thursday, Oct. 17, 2024, at 10:17 a.m. (local time, wherever you are). We never know where or when an earthquake may happen, but preparing is easier than assembling a piece of Scandinavian furniture.

Cover of fictional Great ShakeOut instruction manual.
Cover of fictional Great ShakeOut instruction manual.[Cover]
Did you feel that? The annual Great ShakeOut Earthquake Drill is coming on Thursday, Oct. 17, 2024, at 10:17 a.m. (local time, wherever you are). We never know where or when an earthquake may happen, but preparing is easier than assembling a piece of Scandinavian furniture.
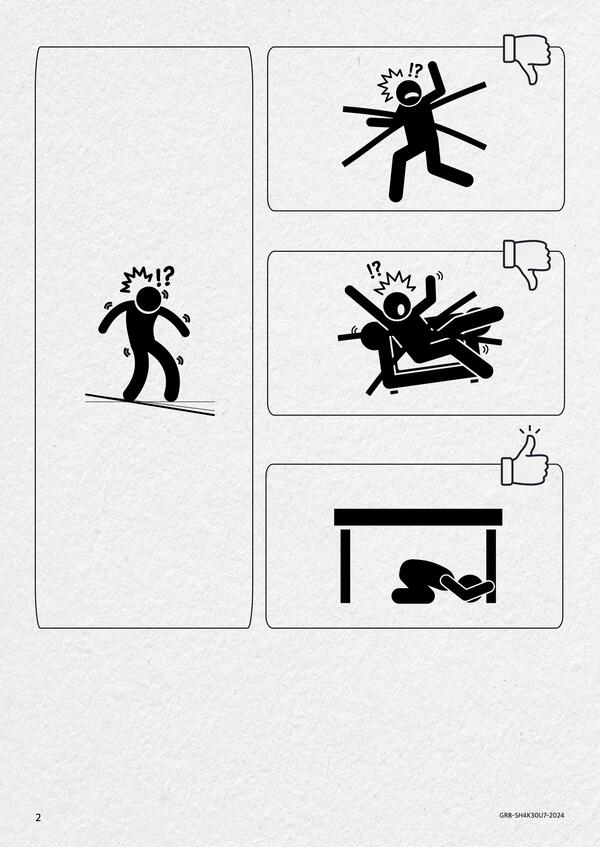
Page 2 of fictional Great ShakeOut instruction manual
Page 2 of fictional Great ShakeOut instruction manual[Page 2]
Did you feel that? The annual Great ShakeOut Earthquake Drill is coming on Thursday, Oct. 17, 2024, at 10:17 a.m. (local time, wherever you are). We never know where or when an earthquake may happen, but preparing is easier than assembling a piece of Scandinavian furniture.

Page 6 of fictional Great ShakeOut instruction manual
Page 6 of fictional Great ShakeOut instruction manual[Page 6]
Did you feel that? The annual Great ShakeOut Earthquake Drill is coming on Thursday, Oct. 17, 2024, at 10:17 a.m. (local time, wherever you are). We never know where or when an earthquake may happen, but preparing is easier than assembling a piece of Scandinavian furniture.

USGS landslide event team activated in wake of Hurricane Helene
USGS landslide event team activated in wake of Hurricane HeleneU.S. Geological Survey landslide experts conduct an aerial reconnaissance flight October 3, 2024, over the southern Appalachian Mountains to get a better understanding of the extent and severity of landslide impacts in the wake of Hurricane Helene, which brought widespread flooding and destruction. (USGS photo by Ben Mirus).

Where Do Landslides Occur?
A map of the United States including Hawaii, Alaska, and Puerto Rico shows landslide susceptibility from yellow (low) to red (high), where the areas without shading represent negligible potential for landslides.
A map of the United States including Hawaii, Alaska, and Puerto Rico shows landslide susceptibility from yellow (low) to red (high), where the areas without shading represent negligible potential for landslides.

¿Dónde Ocurren los Deslizamientos de Tierra?
¿Dónde Ocurren los Deslizamientos de Tierra?
(Mapa Nacional de Susceptibilidad a Deslizamientos de Tierra, 2024)
¿Dónde Ocurren los Deslizamientos de Tierra?
(Mapa Nacional de Susceptibilidad a Deslizamientos de Tierra, 2024)

Coastal Change Forecast for Hurricane Francine
This map, accessible to the public through the U.S. Geological Survey's Coastal Change Hazards Portal, depicts areas along the coasts of Texas, Louisiana and Mississippi that are forecast to experience sand dune erosion, overwash and inundation when Hurricane Francine strikes the U.S. on Wednesday, Sept. 11, 2024. (USGS image).
This map, accessible to the public through the U.S. Geological Survey's Coastal Change Hazards Portal, depicts areas along the coasts of Texas, Louisiana and Mississippi that are forecast to experience sand dune erosion, overwash and inundation when Hurricane Francine strikes the U.S. on Wednesday, Sept. 11, 2024. (USGS image).

Cover image for Marine Minerals b-roll - Seafloor Massive Sulfides
Cover image for Marine Minerals b-roll - Seafloor Massive SulfidesUnderwater footage of seafloor massive sulfides, taken from a remotely operated vehicle.
Cover image for Marine Minerals b-roll - Seafloor Massive Sulfides
Cover image for Marine Minerals b-roll - Seafloor Massive SulfidesUnderwater footage of seafloor massive sulfides, taken from a remotely operated vehicle.

Cover image for Marine minerals b-roll - Marine Phosphorites
Cover image for Marine minerals b-roll - Marine PhosphoritesUnderwater footage of marine phosphorites on seafloor, taken from a remotely operated vehicle.
Cover image for Marine minerals b-roll - Marine Phosphorites
Cover image for Marine minerals b-roll - Marine PhosphoritesUnderwater footage of marine phosphorites on seafloor, taken from a remotely operated vehicle.

Cover image for Marine Minerals b-roll - Ferromanganese Crusts
Cover image for Marine Minerals b-roll - Ferromanganese CrustsUnderwater footage of ferromanganese crust on seafloor, taken from a remotely operated vehicle.
Cover image for Marine Minerals b-roll - Ferromanganese Crusts
Cover image for Marine Minerals b-roll - Ferromanganese CrustsUnderwater footage of ferromanganese crust on seafloor, taken from a remotely operated vehicle.