
3D render of Klamath River Basin, created using TopoRivBlender. Read more about this method at https://waterdata.usgs.gov/blog/topo-riv-blender/
Images
Explore water-related photography, imagery, and illustrations.
Filter Total Items: 2553
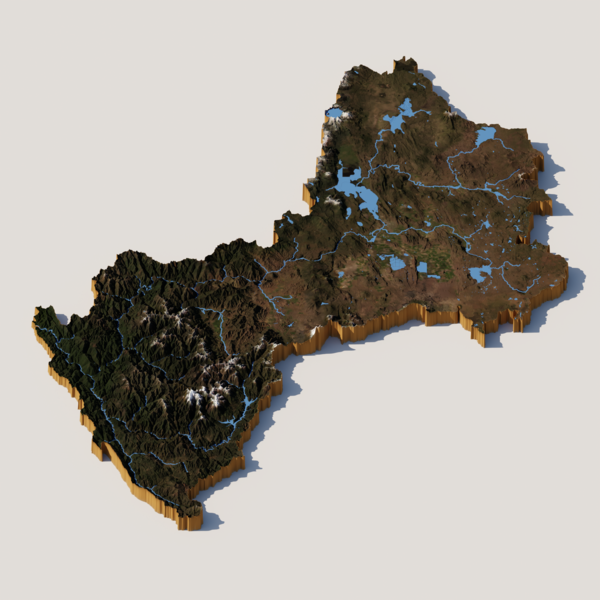
3D render of Klamath River Basin
3D render of Klamath River Basin, created using TopoRivBlender. Read more about this method at https://waterdata.usgs.gov/blog/topo-riv-blender/
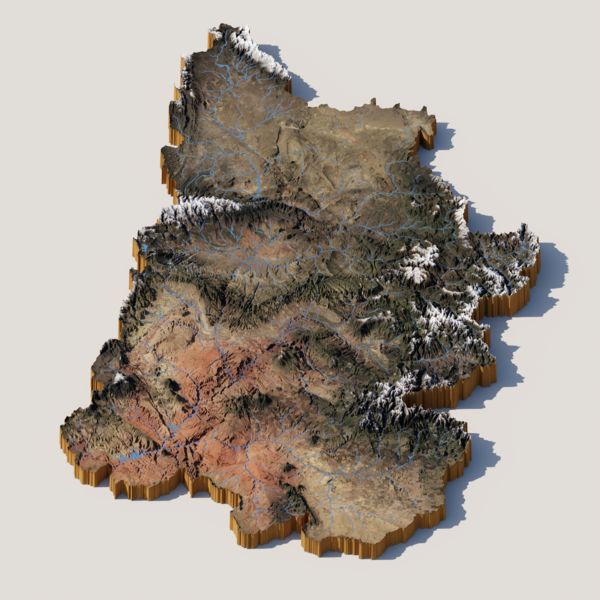
3D render of Upper Colorado River Basin
3D render of Upper Colorado River Basin, created using TopoRivBlender. Read more about this method at https://waterdata.usgs.gov/blog/topo-riv-blender/
3D render of Upper Colorado River Basin, created using TopoRivBlender. Read more about this method at https://waterdata.usgs.gov/blog/topo-riv-blender/
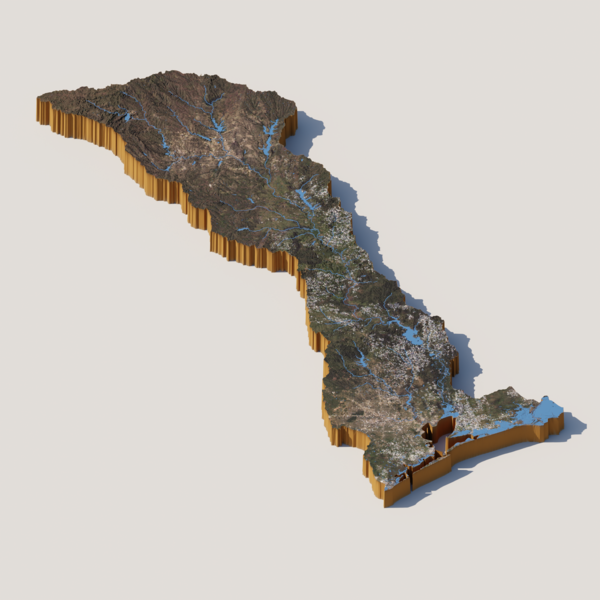
3D render of Illinois River Basin
3D render of the Illinois River Basin, created using TopoRivBlender. Read more about this method at https://waterdata.usgs.gov/blog/topo-riv-blender/
3D render of the Illinois River Basin, created using TopoRivBlender. Read more about this method at https://waterdata.usgs.gov/blog/topo-riv-blender/
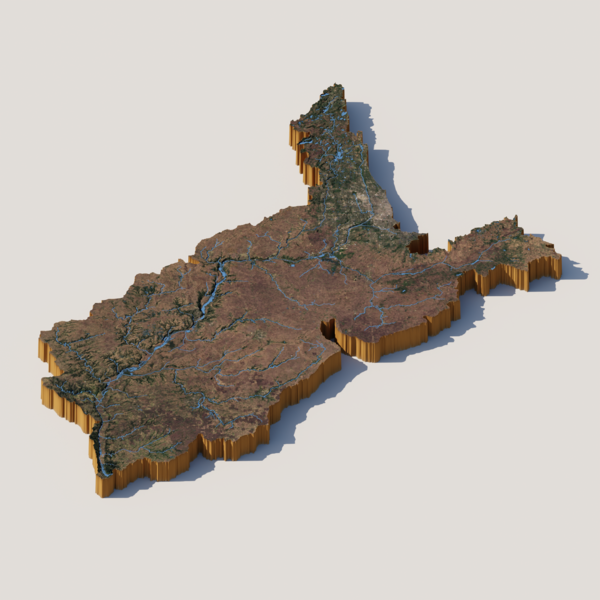
3D render of Trinity-San Jacinto River Basin
3D render of Trinity-San Jacinto, created using TopoRivBlender. Read more about this method at https://waterdata.usgs.gov/blog/topo-riv-blender/
3D render of Trinity-San Jacinto, created using TopoRivBlender. Read more about this method at https://waterdata.usgs.gov/blog/topo-riv-blender/
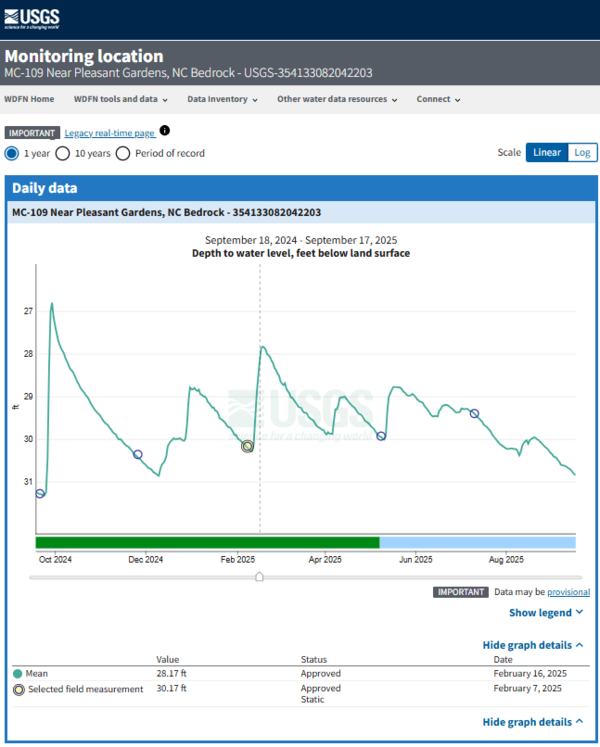
Water Data for the Nation groundwater monitoring location page
Water Data for the Nation groundwater monitoring location pageScreenshot of the Water Data for the Nation (WDFN) groundwater monitoring location page for USGS 354133082042203 MC-109 Near Pleasant Gardens, NC Bedrock.
Water Data for the Nation groundwater monitoring location page
Water Data for the Nation groundwater monitoring location pageScreenshot of the Water Data for the Nation (WDFN) groundwater monitoring location page for USGS 354133082042203 MC-109 Near Pleasant Gardens, NC Bedrock.
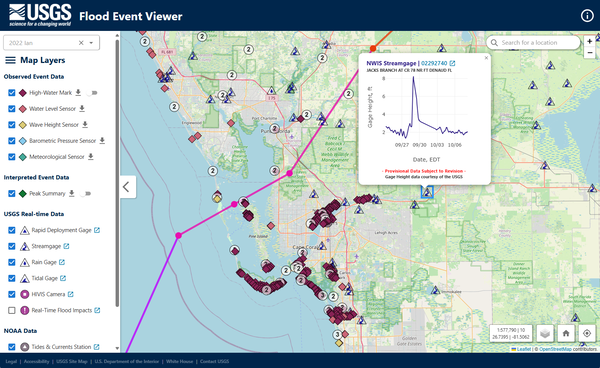
Flood Event Viewer: Hurricane Ian data collection near Fort Myers, Florida
Flood Event Viewer: Hurricane Ian data collection near Fort Myers, FloridaDuring major storms or other short-term events, the USGS collects streamflow and additional data (including storm tide, wave height, high-water marks, and additional sensor deployments) to aid in documenting flood events.
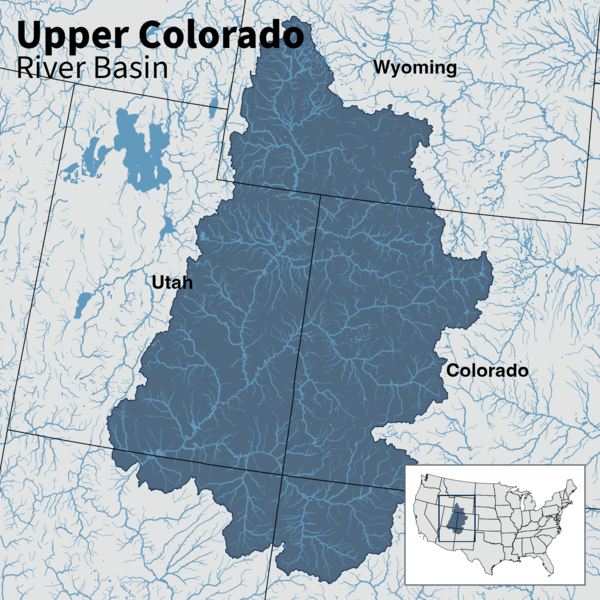
Map of Upper Colorado River Basin - Integrated Water Availability
Map of Upper Colorado River Basin - Integrated Water AvailabilityMap of the Upper Colorado River Basin —referred to as an Integrated Water Science (IWS) basins—are intensively monitored study basins representing a wide range of environmental, hydrologic, and landscape settings and human stressors of water resources to improve our understanding of water availability across the Nation.
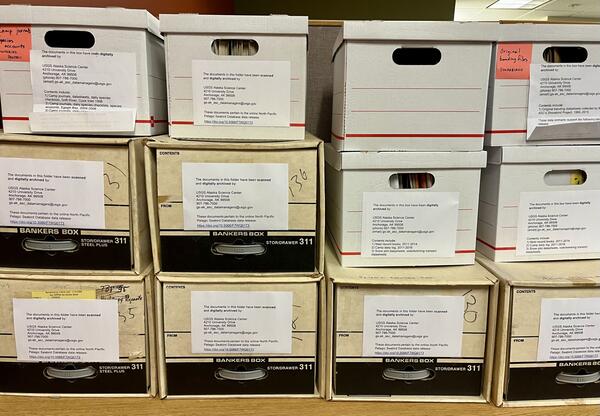
Physical data ready for archive
Alaska Science Center Data Management staff organize, scan, and digitally archive physical data. Once published as part of a data release, the physical data are organized and placed into banker boxes, labeled with pertinent information, such as the data release DOI, and moved to a secure location.
Alaska Science Center Data Management staff organize, scan, and digitally archive physical data. Once published as part of a data release, the physical data are organized and placed into banker boxes, labeled with pertinent information, such as the data release DOI, and moved to a secure location.
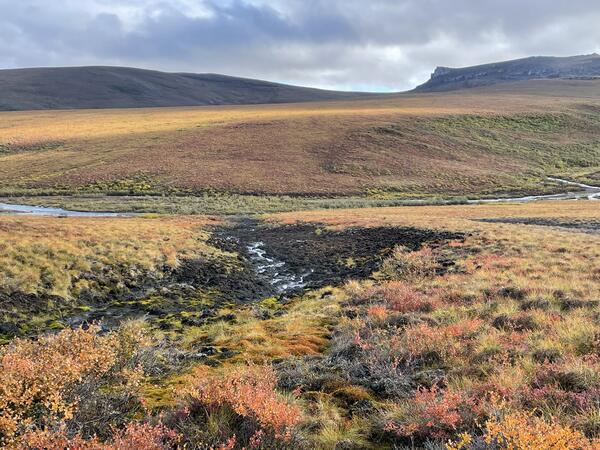
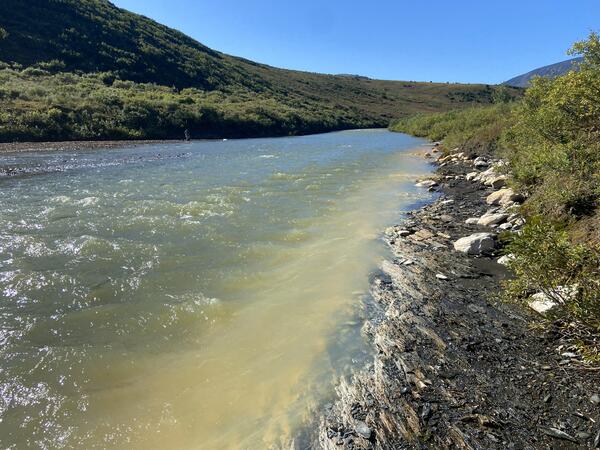
Acidic waters kill and blacken vegetation as they plunge downhill towards the Nakolikurok Creek
Acidic waters kill and blacken vegetation as they plunge downhill towards the Nakolikurok CreekOrange streams are increasingly common in the Brooks Range of northern Alaska. The orange stream color reflects oxidized iron, but also often indicates elevated heavy metal concentrations. Our ongoing study aims to document these occurrences and the timing of their onset.
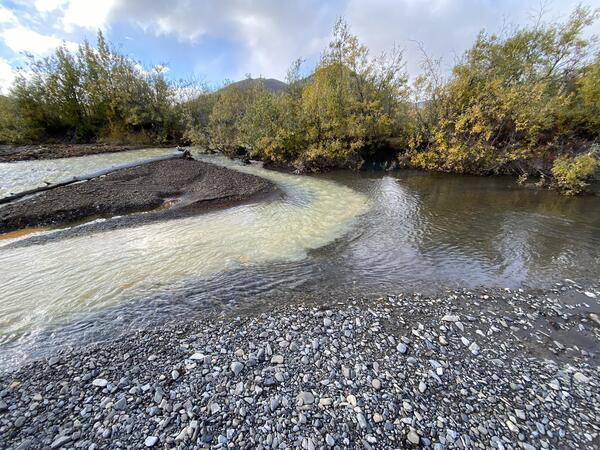
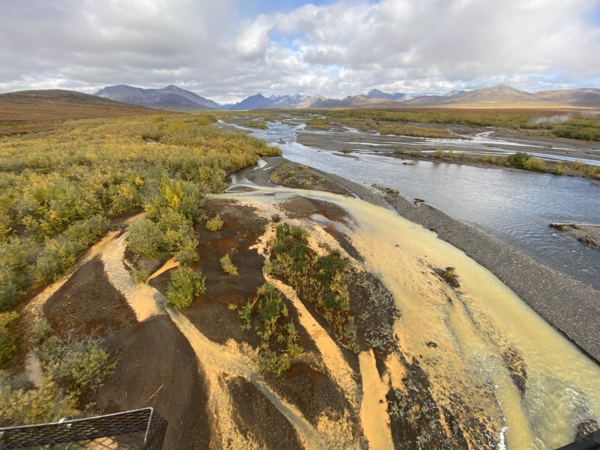
An orange tributary of the Kugururok River in Alaska's Noatak National Preserve
An orange tributary of the Kugururok River in Alaska's Noatak National PreserveOrange streams are increasingly common in the Brooks Range of northern Alaska. The orange stream color reflects oxidized iron, but also often indicates elevated heavy metal concentrations. Our ongoing study aims to document these occurrences and the timing of their onset.
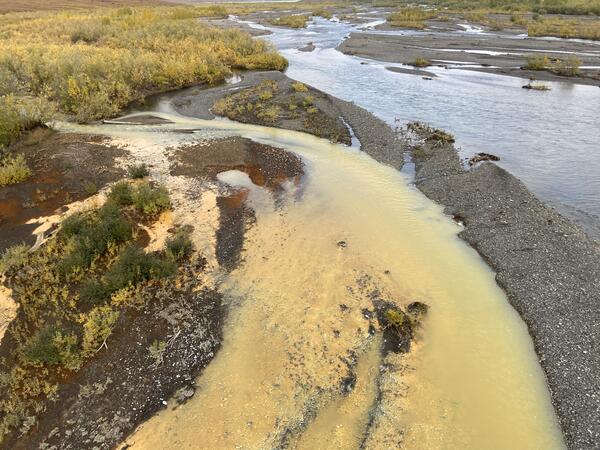
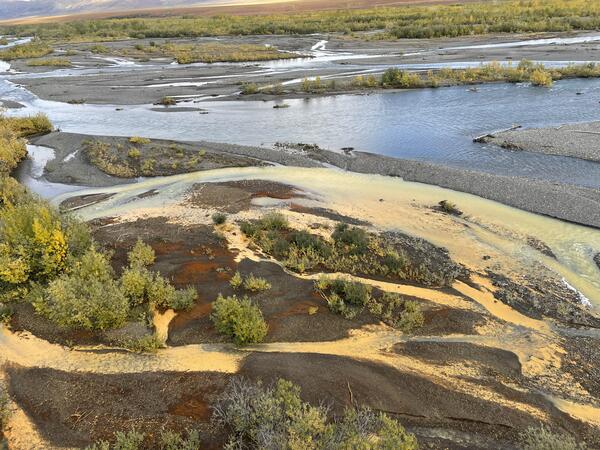
Mixing of an orange tributary and Kugururok River, Noatak National Preserve, Alaska
Mixing of an orange tributary and Kugururok River, Noatak National Preserve, AlaskaOrange streams are increasingly common in the Brooks Range of northern Alaska. The orange stream color reflects oxidized iron, but also often indicates elevated heavy metal concentrations. Our ongoing study aims to document these occurrences and the timing of their onset.
An orange tributary of the Kugururok River in Noatak National Preserve, Alaska
An orange tributary of the Kugururok River in Noatak National Preserve, AlaskaOrange streams are increasingly common in the Brooks Range of northern Alaska. The orange stream color reflects oxidized iron, but also often indicates elevated heavy metal concentrations. Our ongoing study aims to document these occurrences and the timing of their onset.
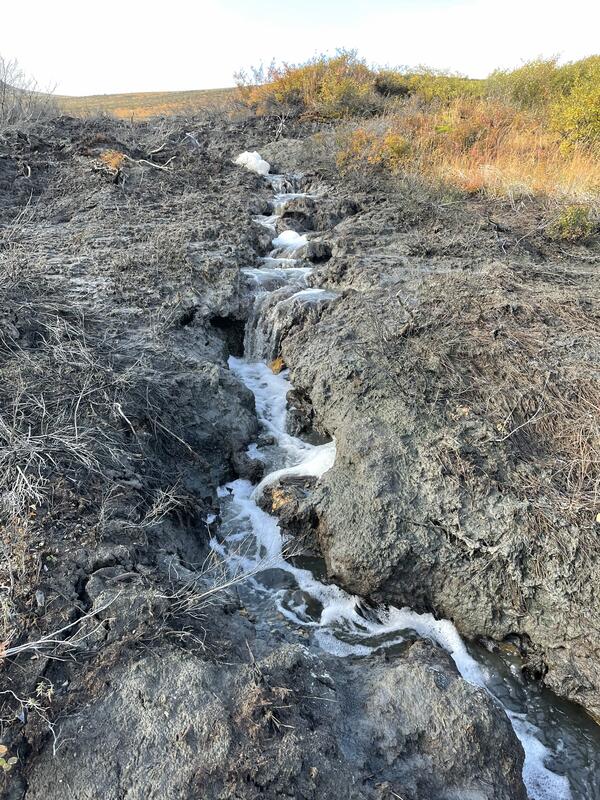
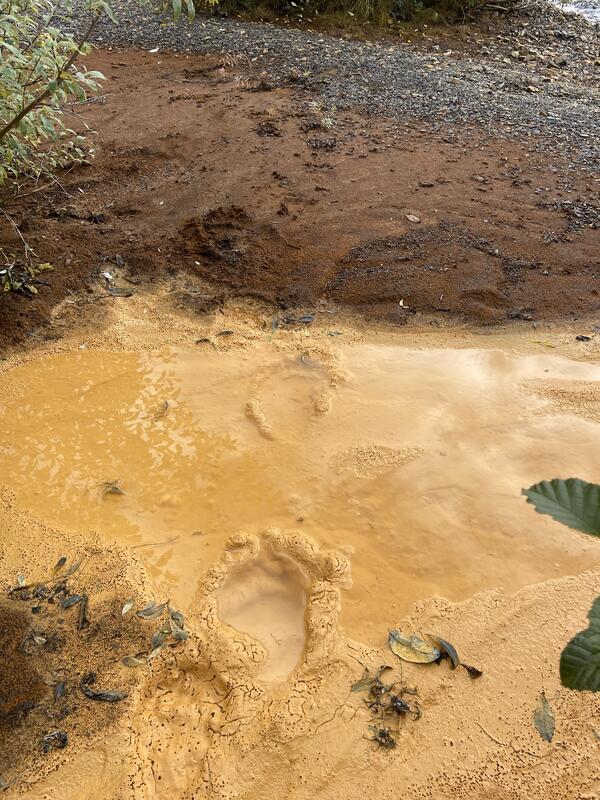
An acid seep on the Nakolikurok Creek
Orange streams are increasingly common in the Brooks Range of northern Alaska. The orange stream color reflects oxidized iron, but also often indicates elevated heavy metal concentrations. Our ongoing study aims to document these occurrences and the timing of their onset.
Orange streams are increasingly common in the Brooks Range of northern Alaska. The orange stream color reflects oxidized iron, but also often indicates elevated heavy metal concentrations. Our ongoing study aims to document these occurrences and the timing of their onset.
Orange waters mixing in to the mainstem of the Kugururok River
Orange waters mixing in to the mainstem of the Kugururok RiverOrange streams are increasingly common in the Brooks Range of northern Alaska. The orange stream color reflects oxidized iron, but also often indicates elevated heavy metal concentrations. Our ongoing study aims to document these occurrences and the timing of their onset.
Bear tracks in an orange tributary of the Kugururok River, Noatak National Preserve, Alaska
Bear tracks in an orange tributary of the Kugururok River, Noatak National Preserve, AlaskaOrange streams are increasingly common in the Brooks Range of northern Alaska. The orange stream color reflects oxidized iron, but also often indicates elevated heavy metal concentrations. Our ongoing study aims to document these occurrences and the timing of their onset.
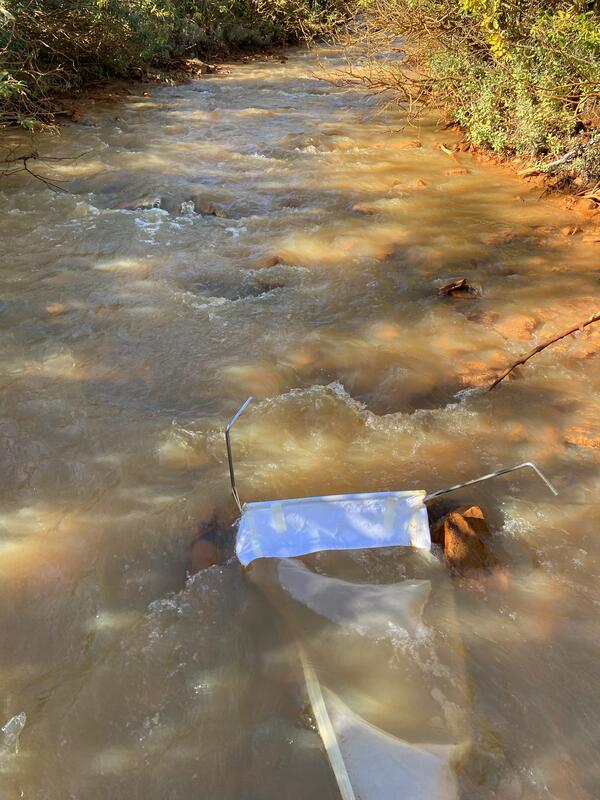
Drift net collecting samples in orange tributary of Anatok Creek, Kobuk Valley National Park, Alaska
Drift net collecting samples in orange tributary of Anatok Creek, Kobuk Valley National Park, AlaskaOrange streams are increasingly common in the Brooks Range of northern Alaska. The orange stream color reflects oxidized iron, but also often indicates elevated heavy metal concentrations. Our ongoing study aims to document these occurrences and the timing of their onset.
Anatok Creek, Kobuk Valley National Park, Alaska
Orange streams are increasingly common in the Brooks Range of northern Alaska. The orange stream color reflects oxidized iron, but also often indicates elevated heavy metal concentrations. Our ongoing study aims to document these occurrences and the timing of their onset.
Orange streams are increasingly common in the Brooks Range of northern Alaska. The orange stream color reflects oxidized iron, but also often indicates elevated heavy metal concentrations. Our ongoing study aims to document these occurrences and the timing of their onset.
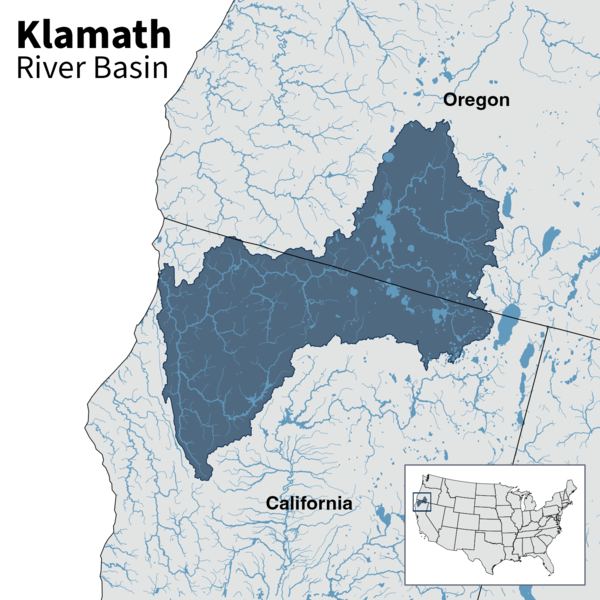
Klamath Basin
Klamath River Basin straddles northern California and southern Oregon. The Klamath River empties into the Pacific Ocean just below the Oregon/California border.
Klamath River Basin straddles northern California and southern Oregon. The Klamath River empties into the Pacific Ocean just below the Oregon/California border.
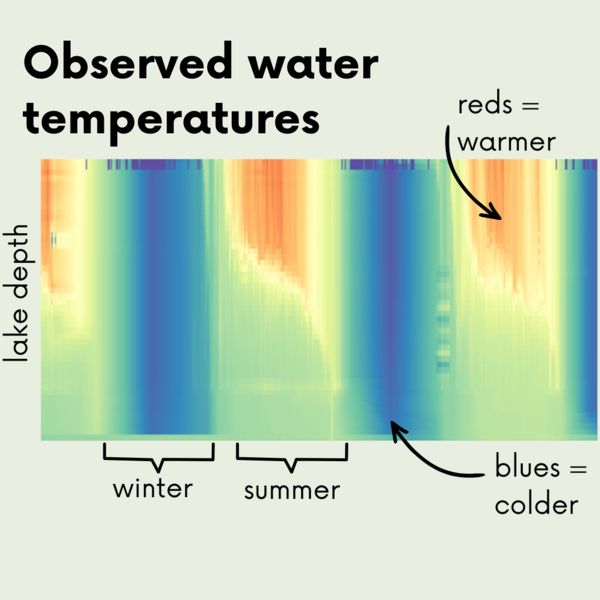
Machine learning of lake temperatures - observed
A lake temperature profile showing two years of temperature data by lake depth. PAtterns of summer warming and winter cooling are visible.
A lake temperature profile showing two years of temperature data by lake depth. PAtterns of summer warming and winter cooling are visible.
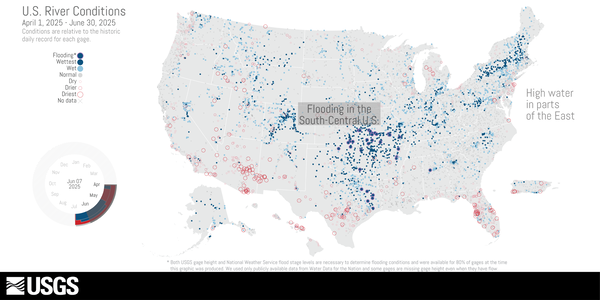
U.S. River Conditions, April to June 2025
U.S. River Conditions, April to June 2025 thumbnail image. The river conditions shown range from the driest condition seen at a gage (red open circles) to the wettest (blue closed circles). A purple outer ring around a gage indicates it is flooding.
U.S. River Conditions, April to June 2025 thumbnail image. The river conditions shown range from the driest condition seen at a gage (red open circles) to the wettest (blue closed circles). A purple outer ring around a gage indicates it is flooding.
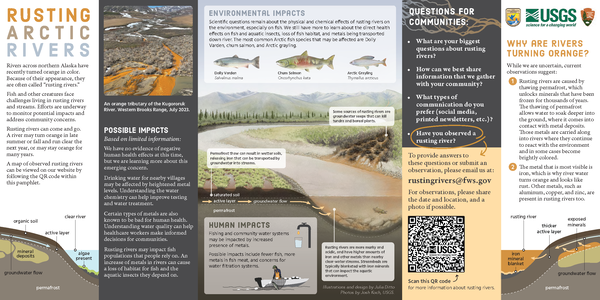
Rusting Arctic Rivers Pamphlet
Rivers across northern Alaska have recently turned orange in color. Because of their appearance, they are often called “rusting rivers.”
Rivers across northern Alaska have recently turned orange in color. Because of their appearance, they are often called “rusting rivers.”