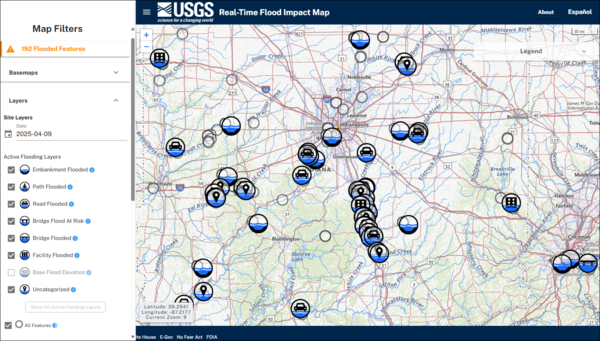
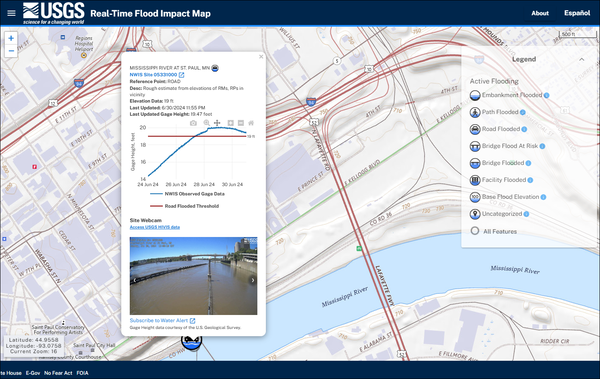
U.S. flag

An official website of the United States government

Images

Explore water-related photography, imagery, and illustrations.

Filter Total Items: 2522
Graphs showing water-year total precipitation and air temperatures in the Lower Colorado River Basin from 1896 to 2019

Graphs showing water-year total precipitation and air temperatures in the Lower Colorado River Basin from 1896 to 2019, units modified from millimeters to inches of precipitation and from degrees Celsius to degrees Fahrenheit from: Tillman, F.D., Gangopadhyay, S., and Pruitt, T., 2020, Trends in recent historical and projected climate data for the Colorado River Bas

U.S. River Conditions, October to December 2024

U.S. River Conditions, October to December 2024 thumbnail image. The river conditions shown range from the driest condition seen at a gage (red open circles) to the wettest (blue closed circles). A purple outer ring around a gage indicates it is flooding. 

U.S. River Conditions, October to December 2024 thumbnail image. The river conditions shown range from the driest condition seen at a gage (red open circles) to the wettest (blue closed circles). A purple outer ring around a gage indicates it is flooding. 

Two USGS scientists lower a water-quality and sediment sampler into a large river from the side of the boat
Water-quality sampling on the Mississippi River

USGS hydrologic technicians collect water-quality samples on the Mississippi River (USGS monitoring location 322023090544500 Mississippi River Above Vicksburg at Mile 438, MS). 

USGS hydrologic technicians collect water-quality samples on the Mississippi River (USGS monitoring location 322023090544500 Mississippi River Above Vicksburg at Mile 438, MS). 

Map of New York State showing the three pilot study areas for interactive products to assist with geothermal drilling.
Geothermal_Picture1.jpg

Map of New York State showing the three pilot study areas for interactive products to assist with geothermal drilling.

Map of New York State showing the three pilot study areas for interactive products to assist with geothermal drilling.

Submerged temperature logger mounted to cobble on riverbed.
Temperature logger in Santiam River basin, Oregon

Temperature logger attached to submerged cobble in Quartzville Creek, OR. This logger was placed as part of an ongoing effort to retrieve continuous temperature data from rivers and tributaries within the Willamette River basin, OR.

Temperature logger attached to submerged cobble in Quartzville Creek, OR. This logger was placed as part of an ongoing effort to retrieve continuous temperature data from rivers and tributaries within the Willamette River basin, OR.

Alton Anderson of the USGS explaining common geophysical tools used to evaluate boreholes to a group of people at a worksite.
Geothermal_Picture3.jpg

Alton Anderson of the USGS explaining common geophysical tools used to evaluate boreholes to a group of people at a worksite.

Alton Anderson of the USGS explaining common geophysical tools used to evaluate boreholes to a group of people at a worksite.

IWAAs product interdependencies
IWAAs product interdependencies (Media Item)

The three Integrated Water Availability Assessment products are designed to be interdependent: 

map showing regional water limitations of the U.S.
IWAAs - levels of water limitations

Water limitation across the lower 48 United States, shown as the average from 2010 to 2020 for each watershed (HUC12). Water limitation levels were based on the surface water supply and use index, which expresses the imbalance between surface water-supply and consumptive use.

Water limitation across the lower 48 United States, shown as the average from 2010 to 2020 for each watershed (HUC12). Water limitation levels were based on the surface water supply and use index, which expresses the imbalance between surface water-supply and consumptive use.

Thumbnail image for U.S. River Conditions for Water Year 2024
U.S. River Conditions for Water Year 2024

This is a thumbnail for an animation showing the changing conditions relative to the historic record of USGS streamgages from October 1, 2023 - September 30, 2024. The river conditions shown range from the driest condition seen at a gage (red open circles) to the wettest (blue closed circles).

This is a thumbnail for an animation showing the changing conditions relative to the historic record of USGS streamgages from October 1, 2023 - September 30, 2024. The river conditions shown range from the driest condition seen at a gage (red open circles) to the wettest (blue closed circles).

Thumbnail image for a promotional video about the USGS Hydrologic Instrumentation Facility in Tuscaloosa, Alabama.

Large text reads, “Hydrologic Instrumentation Facility: A new era for water science and technology.” Text sits over an aerial image of the Hydrologic Instrumentation Facility (HIF), with the tree-lined Black Warrior River visible in the background.

Aerial image of the Hydrologic Instrumentation Facility (HIF), with the tree-lined Black Warrior River visible in the back.
Hydrologic Instrumentation Facility: A new era for water science and technology

Large text reads, “Hydrologic Instrumentation Facility: A new era for water science and technology.” Text sits over an aerial image of the Hydrologic Instrumentation Facility, with the tree-lined Black Warrior River visible in the background.

Large text reads, “Hydrologic Instrumentation Facility: A new era for water science and technology.” Text sits over an aerial image of the Hydrologic Instrumentation Facility, with the tree-lined Black Warrior River visible in the background.

Map showing U.S. River Conditions, July to September 2024
U.S. River Conditions, July to September 2024

U.S. River Conditions, July to September 2024 thumbnail image. The river conditions shown range from the driest condition seen at a gage (red open circles) to the wettest (blue closed circles). A purple outer ring around a gage indicates it is flooding.   

U.S. River Conditions, July to September 2024 thumbnail image. The river conditions shown range from the driest condition seen at a gage (red open circles) to the wettest (blue closed circles). A purple outer ring around a gage indicates it is flooding.   

Diagram showing the flow of water for conventional flotation processing of copper ores (Bleiwas, 2012)
Schematic Diagram of Water Flow for Conventional Flotation Processing of Copper Ores (Bleiwas, 2012)

Schematic diagram of water flow for conventional flotation processing of copper ores from Bleiwas, D.I., 2012, Estimated water requirements for the conventional flotation of copper ores: U.S. Geological Survey Open-File Report 2012–1089, 13 p., available at https://pubs.usgs.gov/publication/ofr20121089

Image shows a large pile of debris left behind after major flooding. A damaged camper can be seen in the pile.
Aftermath of severe flooding on Pigeon River in Newport, Tennessee

USGS Hydrologic Technician Pamela Loftin looks on at the aftermath of severe flooding on Pigeon River in Newport, Tennessee. USGS crews were onsite October 1 to measure high-water marks to determine how high the flood waters reached at this location. Photo by Logan Combs, USGS. 

USGS Hydrologic Technician Pamela Loftin looks on at the aftermath of severe flooding on Pigeon River in Newport, Tennessee. USGS crews were onsite October 1 to measure high-water marks to determine how high the flood waters reached at this location. Photo by Logan Combs, USGS. 

A model shows the process of cloud-water interception in the island environment.
Water Cycle Image.jpg

This image shows the cloud-water interception process in an island environment like the Hawaiian islands.

This image shows the cloud-water interception process in an island environment like the Hawaiian islands.

Graphs showing trends in mean annual atmospheric precipitation and air temperature in the Lower Colorado River Basin, 1896-2019
Mean atmospheric precipitation and air temperature in the Lower Colorado River Basin, 1896-2019

Graphs showing mean annual precipitation and air temperature trends in the Lower Colorado River Basin, 1896-2019, published in: Tillman, F.D., Gangopadhyay, S., and Pruitt, T., 2020, Trends in recent historical and projected climate data for the Colorado River Basin and potential effects on groundwater availability: U.S.

Graphs showing mean annual precipitation and air temperature trends in the Lower Colorado River Basin, 1896-2019, published in: Tillman, F.D., Gangopadhyay, S., and Pruitt, T., 2020, Trends in recent historical and projected climate data for the Colorado River Basin and potential effects on groundwater availability: U.S.

Was this page helpful?