
USGS map identifying the percent probability for any location in New Hampshire to have groundwater with radon concentrations greater than the state government’s standard of 2,000 picocuries per liter for drinking water.
Images
Explore water-related photography, imagery, and illustrations.
Filter Total Items: 2560

Radon in New Hampshire Groundwater
USGS map identifying the percent probability for any location in New Hampshire to have groundwater with radon concentrations greater than the state government’s standard of 2,000 picocuries per liter for drinking water.

Illinois River Basin low-level flight overview
This map shows the airborne geophysical survey area and planned flight paths across the Illinois River Basin in Illinois and northwest Indiana. Surveys will not occur directly above populated areas. Planned flight lines and survey progress can be found online.
(USGS map)
This map shows the airborne geophysical survey area and planned flight paths across the Illinois River Basin in Illinois and northwest Indiana. Surveys will not occur directly above populated areas. Planned flight lines and survey progress can be found online.
(USGS map)

Thumbnail of River Conditions Oct 1 thru Sept 30 2022
Thumbnail of River Conditions Oct 1 thru Sept 30 2022This is a still, thumbnail image for the U.S. river conditions for Oct 1, 2022 through September 30, 2022.
Thumbnail of River Conditions Oct 1 thru Sept 30 2022
Thumbnail of River Conditions Oct 1 thru Sept 30 2022This is a still, thumbnail image for the U.S. river conditions for Oct 1, 2022 through September 30, 2022.

Thumbnail of River Conditions from Oct 1 2022 to Dec 31 2022
Thumbnail of River Conditions from Oct 1 2022 to Dec 31 2022Thumbnail image of US river conditions from October 1, 2022 to December 31, 2022.
Thumbnail of River Conditions from Oct 1 2022 to Dec 31 2022
Thumbnail of River Conditions from Oct 1 2022 to Dec 31 2022Thumbnail image of US river conditions from October 1, 2022 to December 31, 2022.

December 2022 Streamflow Tile Map
A tile map of the US showing streamgages by flow levels through the month of December 2022. For each state, an area chart shows the proportion of streamgages in wet, normal, or dry conditions. Streamflow conditions are quantified using percentiles comparing the past month’s flow levels to the historic record for each streamgage.
A tile map of the US showing streamgages by flow levels through the month of December 2022. For each state, an area chart shows the proportion of streamgages in wet, normal, or dry conditions. Streamflow conditions are quantified using percentiles comparing the past month’s flow levels to the historic record for each streamgage.

Arroyo Hondo CA
USGS Arroyo Hondo near San Jose CA (11173200) streamgaging station in January 2023 (watershed burned by SCU Lightning Complex in August 2020) (photo by Emily Zierdt-Smith, USGS)
USGS Arroyo Hondo near San Jose CA (11173200) streamgaging station in January 2023 (watershed burned by SCU Lightning Complex in August 2020) (photo by Emily Zierdt-Smith, USGS)

Tis the season to be snowy! Data Viz
A map of the contiguous U.S. using a snowflake hex pattern to show snow persistence over a 20-year period. Snow persistence is measured as the snow cover index, or the average fraction of time snow was on the ground from Jan 1 to. July 3 from 2001-2020.
A map of the contiguous U.S. using a snowflake hex pattern to show snow persistence over a 20-year period. Snow persistence is measured as the snow cover index, or the average fraction of time snow was on the ground from Jan 1 to. July 3 from 2001-2020.

High water mark on streamgage 11161000 San-Lorenzo-River Santa-Cruz
High water mark on streamgage 11161000 San-Lorenzo-River Santa-CruzSharon Mulready, USGS Hydrologic Technician, recording the high-water mark on gage 11161000 San Lorenzo River Santa Cruz. The stream is filled with a tremendous amount of sediment moved by the storm on December 31st, 2022.

High water in the Walnut Creek watershed
High water in the Walnut Creek watershed in Raleigh, North Carolina, in 2022. Flooding can impact nearby infrastructure, including homes, businesses, roads and trails. Credit: Kristina Hopkins, USGS.
High water in the Walnut Creek watershed in Raleigh, North Carolina, in 2022. Flooding can impact nearby infrastructure, including homes, businesses, roads and trails. Credit: Kristina Hopkins, USGS.

PFAS in Select U.S. Tapwater Locations
This USGS map shows the number of PFAS detected in tap water samples from select sites across the nation. The findings are based on a USGS study of samples taken between 2016 and 2021 from private and public supplies at 716 locations. The map does not represent the only locations in the U.S. with PFAS.
This USGS map shows the number of PFAS detected in tap water samples from select sites across the nation. The findings are based on a USGS study of samples taken between 2016 and 2021 from private and public supplies at 716 locations. The map does not represent the only locations in the U.S. with PFAS.

Rancho Guejito Streamgage
A photo of a USGS streamgage and a USGS employee. The gage and the employee look small compared to the very large rocks that they are on top of. There is a small water fall to the left of the gage and the employee. This gage is in Rancho Guejito, California.
A photo of a USGS streamgage and a USGS employee. The gage and the employee look small compared to the very large rocks that they are on top of. There is a small water fall to the left of the gage and the employee. This gage is in Rancho Guejito, California.

Deicing salt applied to parking lots
The Delaware River Basin had upward trends in specific conductance, total dissolved solids, chloride, and sodium. Deicing salt applied to parking lots can be a source of these constituents in water bodies (Photo by Meg Shoda, USGS, December 2020).
The Delaware River Basin had upward trends in specific conductance, total dissolved solids, chloride, and sodium. Deicing salt applied to parking lots can be a source of these constituents in water bodies (Photo by Meg Shoda, USGS, December 2020).

USGS scientist prepares drone ground-penetrating radar for peat mapping
USGS scientist prepares drone ground-penetrating radar for peat mappingUSGS recently tested ground-penetrating radar (GPR) on a drone for mapping peat thickness and extent. This work is part of a collaboration with Florida Atlantic University to study and locate large carbon gas emissions from peat soils in the swampy wetlands of the Everglades in Florida.

USGS conducts ground-penetrating radar survey to map peat
USGS conducts ground-penetrating radar survey to map peatUSGS recently tested ground-penetrating radar (GPR) on a drone for mapping peat thickness and extent. This work is part of a collaboration with Florida Atlantic University to study and locate large carbon gas emissions from peat soils in the swampy wetlands of the Everglades in Florida.

Scientists Promoting the USGS National Water Census
Scientists Promoting the USGS National Water CensusScientists from the National Water Census team (Shirley Leung, Kaycee Faunce, and Alice McCarthy) attend a conference to discuss USGS water data and products with USGS water data users.
Scientists Promoting the USGS National Water Census
Scientists Promoting the USGS National Water CensusScientists from the National Water Census team (Shirley Leung, Kaycee Faunce, and Alice McCarthy) attend a conference to discuss USGS water data and products with USGS water data users.

PEST Observation Locations in ModelMuse
This image displays the ModelMuse main window with several objects that define calibration observations displayed. The image is intended to be used with a video.
This image displays the ModelMuse main window with several objects that define calibration observations displayed. The image is intended to be used with a video.

ModelMuse with PEST-Calibrated Hydraulic Conductivity
ModelMuse with PEST-Calibrated Hydraulic ConductivityScreen capture of the ModelMuse main window with the cells colored with the hydraulic conductivity after being calibrated using PEST.
The image is intended to introduce a video.
ModelMuse with PEST-Calibrated Hydraulic Conductivity
ModelMuse with PEST-Calibrated Hydraulic ConductivityScreen capture of the ModelMuse main window with the cells colored with the hydraulic conductivity after being calibrated using PEST.
The image is intended to introduce a video.

October 2022 Streamflow Tile Map
A tile map of the US showing streamgages by flow levels through the month of October 2022. For each state, an area chart shows the proportion of streamgages in wet, normal, or dry conditions. Streamflow conditions are quantified using percentiles comparing the past month’s slow levels to the historic record for each streamgage.
A tile map of the US showing streamgages by flow levels through the month of October 2022. For each state, an area chart shows the proportion of streamgages in wet, normal, or dry conditions. Streamflow conditions are quantified using percentiles comparing the past month’s slow levels to the historic record for each streamgage.
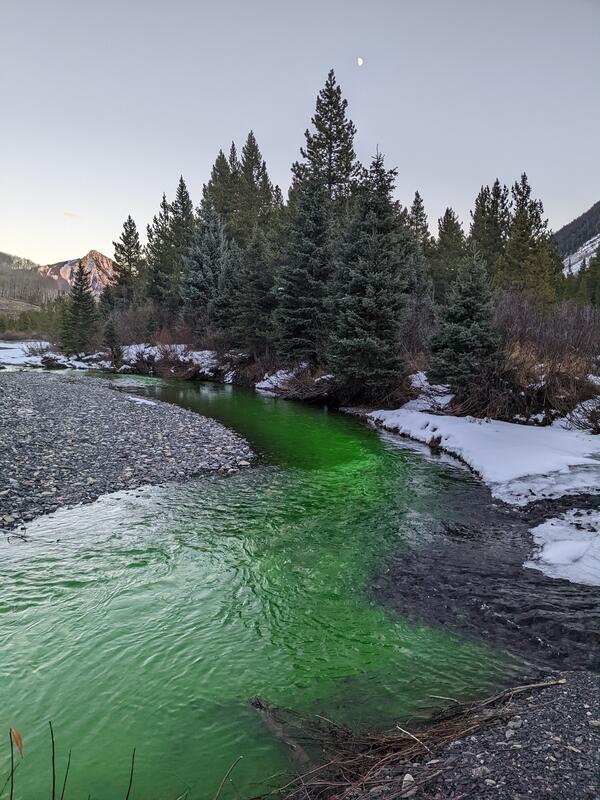
Dye tracer study in the Slate River, Colorado
Sodium fluorescein dye injection into the Slate River used to measure how much groundwater flows into it.
Sodium fluorescein dye injection into the Slate River used to measure how much groundwater flows into it.

View of the inside of a groundwater well
What does the inside of a groundwater well look like? This can be an important question for groundwater scientists! In this photo, we see the view from a video camera inside a groundwater well. USGS scientists can use cameras to inspect the inside of a well to identify any changes in the well that might affect groundwater level measurements over time.
What does the inside of a groundwater well look like? This can be an important question for groundwater scientists! In this photo, we see the view from a video camera inside a groundwater well. USGS scientists can use cameras to inspect the inside of a well to identify any changes in the well that might affect groundwater level measurements over time.

Population potentially affected by groundwater contaminants - Graph
Population potentially affected by groundwater contaminants - GraphGraph of population potentially affected by groundwater contaminants (Belitz and others, 2022). Geogenic constituents affected a larger population compared to anthropogenic constituents.