
Hi, I'm Salty, Drippy's saline counterpart! Did you know that one way to produce table salt is to evaporate saline water in evaporation ponds, a technique used by people for thousands of years?
Images
Explore water-related photography, imagery, and illustrations.
Filter Total Items: 2560

Salty: Did you know? Evaporation
Hi, I'm Salty, Drippy's saline counterpart! Did you know that one way to produce table salt is to evaporate saline water in evaporation ponds, a technique used by people for thousands of years?
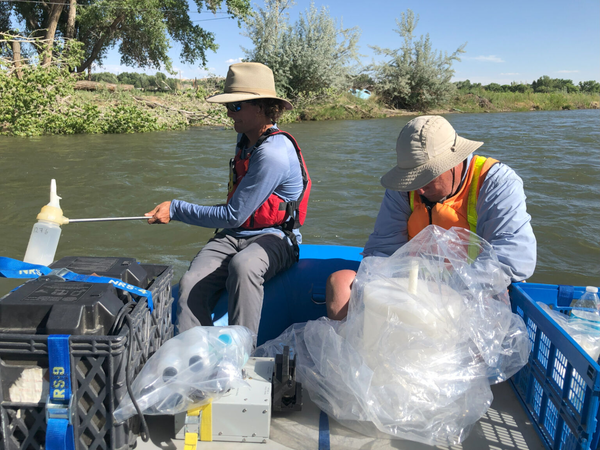
Sampling surface water on the Animas River, New Mexico, 2022
Sampling surface water on the Animas River, New Mexico, 2022USGS researchers collect surface water samples on the Animas River, New Mexico, June 2022
Sampling surface water on the Animas River, New Mexico, 2022
Sampling surface water on the Animas River, New Mexico, 2022USGS researchers collect surface water samples on the Animas River, New Mexico, June 2022

Collection Of Sediment And Water Sampling Prior To The Possible Occurrence Of Oil Contamination From The Deepwater Horizon Oil Well At Egmont Key, Florida
Collection Of Sediment And Water Sampling Prior To The Possible Occurrence Of Oil Contamination From The Deepwater Horizon Oil Well At Egmont Key, FloridaBruce Bernard (left) and Scott McBride (right) obtain water and sediment samples at Egmont Key which is about 1 mile west of the mouth of Tampa Bay in the Gulf of America. Samples were collected June 14, 2010 prior to the possible occurrence of oil contamination from the Deepwater Horizon's oil well.
Collection Of Sediment And Water Sampling Prior To The Possible Occurrence Of Oil Contamination From The Deepwater Horizon Oil Well At Egmont Key, Florida
Collection Of Sediment And Water Sampling Prior To The Possible Occurrence Of Oil Contamination From The Deepwater Horizon Oil Well At Egmont Key, FloridaCollection Of Sediment And Water Sampling Prior To The Possible Occurrence Of Oil Contamination From The Deepwater Horizon Oil Well At Egmont Key, Florida
Collection Of Sediment And Water Sampling Prior To The Possible Occurrence Of Oil Contamination From The Deepwater Horizon Oil Well At Egmont Key, FloridaBruce Bernard (left) and Scott McBride (right) obtain water and sediment samples at Egmont Key which is about 1 mile west of the mouth of Tampa Bay in the Gulf of America. Samples were collected June 14, 2010 prior to the possible occurrence of oil contamination from the Deepwater Horizon's oil well.

Sunset over Medina Lake near San Antonio, Texas, May 25, 2022
Sunset over Medina Lake near San Antonio, Texas, May 25, 2022Still-shot from webcam of sunset over Medina Lake near San Antonio, Texas, May 25, 2022. USGS Site: 08179500. Image from the Hydrologic Imagery Visualization and Information System (https://apps.usgs.gov/hivis/).

#RecreateWithUSGS social media card
Participate in this national photo contest, #RecreateWithUSGS, for a chance to win the title of Water Recreation Photo Champion. More rules apply, see more details.
Participate in this national photo contest, #RecreateWithUSGS, for a chance to win the title of Water Recreation Photo Champion. More rules apply, see more details.

Scientists Deploy Buoy Platform with Water Quality Instruments in Southport Harbor, CT
Scientists Deploy Buoy Platform with Water Quality Instruments in Southport Harbor, CTUSGS deployed this buoy platform with connected water quality equipment in Southport Harbor, CT in May 2022.
Scientists Deploy Buoy Platform with Water Quality Instruments in Southport Harbor, CT
Scientists Deploy Buoy Platform with Water Quality Instruments in Southport Harbor, CTUSGS deployed this buoy platform with connected water quality equipment in Southport Harbor, CT in May 2022.

Deploying a Buoy Platform in Southport Harbor, CT
USGS deployed this buoy platform with connected water quality equipment in Southport Harbor, CT in May 2022.
USGS deployed this buoy platform with connected water quality equipment in Southport Harbor, CT in May 2022.
Vizlab Logo
A thumbnail image of the Vizlab logo. It features the words and a drawing of a gage.
A thumbnail image of the Vizlab logo. It features the words and a drawing of a gage.

April 2022 Streamflow Conditions
A cartogram map of the US with proportional area charts for each state showing the proportion of streamgages by flow level. Streamflow levels are shown as percentiles of the historic daily record at each gage, and binned to reflect whether flow conditions are wetter or drier than the historical record.
A cartogram map of the US with proportional area charts for each state showing the proportion of streamgages by flow level. Streamflow levels are shown as percentiles of the historic daily record at each gage, and binned to reflect whether flow conditions are wetter or drier than the historical record.

Field Photo Friday image for 5.6.2022: USGS gage 10317500, on the North Fork, of the Humbolt River near Halleck, Nevada
Field Photo Friday image for 5.6.2022: USGS gage 10317500, on the North Fork, of the Humbolt River near Halleck, NevadaHere is the beautiful USGS gage 10317500, on the North Fork, of the Humbolt River near Halleck, Nevada, a bit Northwest from The East Humboldt Range and the Humboldt-Toiyabe National Forest. Water data back to 1913 are available online.

OGC API Processes for USGS Water Data
On April 25th, 2022, the Water Data for the Nation team hosted the 3rd webinar in our API series. This webinar focused on another OGC (Open Geospatial Consortium) API called Processes.
On April 25th, 2022, the Water Data for the Nation team hosted the 3rd webinar in our API series. This webinar focused on another OGC (Open Geospatial Consortium) API called Processes.

How Far Away is Your Closest Streamgage?
A map of USGS streamgages and population density shows the proximity of gages to people. In addition, a line chart is overlaid showing the total population within 3 distances from any gage in the US. These distances represent a normal walking distance, biking distance, and driving distance.
A map of USGS streamgages and population density shows the proximity of gages to people. In addition, a line chart is overlaid showing the total population within 3 distances from any gage in the US. These distances represent a normal walking distance, biking distance, and driving distance.

A Tale of Two Basins
A Tale of Two Basins. This circular chart shows the Upper Colorado River basin and the Lower Colorado River basin side by side. The Upper Colorado basin chart shows that February 4 is the driest day of the year and June 8 is the wettest day of the year.
A Tale of Two Basins. This circular chart shows the Upper Colorado River basin and the Lower Colorado River basin side by side. The Upper Colorado basin chart shows that February 4 is the driest day of the year and June 8 is the wettest day of the year.

Land Cover Change in the Delaware River Basin
Land cover is animated through time in the Delaware River Basin. The visual shows a map and chart reflecting the proportion of land area in 8 major land cover classes: water, agriculture, barren, forest, grassland, wetland and developed areas (low and high intensity). Time is broken into 10 year intervals.
Land cover is animated through time in the Delaware River Basin. The visual shows a map and chart reflecting the proportion of land area in 8 major land cover classes: water, agriculture, barren, forest, grassland, wetland and developed areas (low and high intensity). Time is broken into 10 year intervals.

When are U.S. Rivers Wet or Dry?
When are U.S. rivers wet or dry? This circular area chart displays the total flow rate in million cubic feet per second throughout a year. Total flow is derived from 1,865 USGS NWIS gages with near complete data for 1951-2020.
When are U.S. rivers wet or dry? This circular area chart displays the total flow rate in million cubic feet per second throughout a year. Total flow is derived from 1,865 USGS NWIS gages with near complete data for 1951-2020.

The Rise and Fall of the Delaware Salt Front
The rise and fall of the Delaware River salt front. Over time, the location of the salt front moves in response to regional weather patterns, sea level rise, and human impacts. The precise location of the salt front in the Delaware River Basin is based on the location in the river where the average chloride concentration is 250 mg/L.
The rise and fall of the Delaware River salt front. Over time, the location of the salt front moves in response to regional weather patterns, sea level rise, and human impacts. The precise location of the salt front in the Delaware River Basin is based on the location in the river where the average chloride concentration is 250 mg/L.

ScientistS2F_Thumbnail.png
A graphic showing a mountain with a snowcap. Names of scientists are next to arrows that show where on the mountain they work to measure snowmelt.
A graphic showing a mountain with a snowcap. Names of scientists are next to arrows that show where on the mountain they work to measure snowmelt.

40+ Years of Streamflow Drought in the Upper Colorado River Basin
40+ Years of Streamflow Drought in the Upper Colorado River BasinA time series of streamflow drought events occurring across 122 stream gages in the Upper Colorado River basin from 1980 to present. Periods of streamflow drought are indicated for each of 122 gages in a beeswarm-like chart, with time on the x-axis. During time periods where many gages experienced drought, the swarm bulges due to many co-occurring events.

Changes in Temperature and Timing for Lake in the Contiguous U.S.
Changes in Temperature and Timing for Lake in the Contiguous U.S.A map of CONUS using angled wheat field vectors to compare lake growing degree days between the past (1981-1990) and present (2011-2020). The vectors are mapped to the number of growing degree days earlier or later on the x-axis, and the difference in temperature on the y-axis, resulting in vector angles spanning 360 degrees.

The Way The River Flows
The way the river flows. A series of radial plots showing the river length by flow direction across select U.S. watersheds. Bar length is proportional to the relative river distance within 10 degree bins. An example of Puyallup in WA is shown which generally flows northwest, from its’ headwaters near Mt. Ranier towards Puget Sound.
The way the river flows. A series of radial plots showing the river length by flow direction across select U.S. watersheds. Bar length is proportional to the relative river distance within 10 degree bins. An example of Puyallup in WA is shown which generally flows northwest, from its’ headwaters near Mt. Ranier towards Puget Sound.

Streamflow Drought Duration 2020 & 2021
A time series of streamflow drought events occurring across 122 stream gages in the Upper Colorado River basin for 2020 through October 1, 2021. At the beginning of 2020 few gages were in drought status, but as the 2020 summer proceeded there was a surge in drought conditions continuing through the end of 2021.
A time series of streamflow drought events occurring across 122 stream gages in the Upper Colorado River basin for 2020 through October 1, 2021. At the beginning of 2020 few gages were in drought status, but as the 2020 summer proceeded there was a surge in drought conditions continuing through the end of 2021.