
A photo of Scott Hamshaw. Scott is a Machine Learning Specialist in the Water Resources Mission Area of the U.S. Geological Survey.
Images
Explore water-related photography, imagery, and illustrations.
Filter Total Items: 2560

Scott Hamshaw
A photo of Scott Hamshaw. Scott is a Machine Learning Specialist in the Water Resources Mission Area of the U.S. Geological Survey.

August 2022 Streamflow
A cartogram map of the US with proportional area charts for each state showing the proportion of streamgages by flow levels, categorized using percentile bins. Streamflow level percentiles are calculated using the historic daily record for each gage, and binned to reflect whether flow conditions are wetter or drier than the historical record.
A cartogram map of the US with proportional area charts for each state showing the proportion of streamgages by flow levels, categorized using percentile bins. Streamflow level percentiles are calculated using the historic daily record for each gage, and binned to reflect whether flow conditions are wetter or drier than the historical record.

Photograph of trees along the coast at Acadia National Park. Promotion for Recreate With USGS photo contest.
Photograph of trees along the coast at Acadia National Park. Promotion for Recreate With USGS photo contest.Photograph of trees along the coast at Acadia National Park. Promotion for Recreate With USGS campaign.
Steps to enter our photo contest
-
Take a photo while you’re out recreating on, in, or near water

Transitioning to NextGen WaterAlert in 3 simple steps
Transitioning to NextGen WaterAlert in 3 simple stepsOn August 24th at 1 pm ET/ 10 am PT we hosted a public webinar to guide users through the 3 steps necessary to transition from Legacy to Next Generation WaterAlert. Catch the recording on the USGS YouTube channel.

USGS NGWOS Groundwater Wells, Mason County, Illinois
USGS NGWOS Groundwater Wells, Mason County, IllinoisThis August 2022 photo is of a new group (or “nest”) of groundwater wells that are part of a USGS Next Generation Water Observing System (NGWOS) project in the
USGS NGWOS Groundwater Wells, Mason County, Illinois
USGS NGWOS Groundwater Wells, Mason County, IllinoisThis August 2022 photo is of a new group (or “nest”) of groundwater wells that are part of a USGS Next Generation Water Observing System (NGWOS) project in the

Johanna Blake at Gallinas Cr NM
USGS Gallinas Creek near Montezuma, NM (08380500) streamgaging and water-quality monitoring station in August 2022 (watershed burned by Calf Canyon/Hermit Peak Fires April-August 2022) (photo showing Johanna Blake, USGS; photo by Jeannie Barlow, USGS)
USGS Gallinas Creek near Montezuma, NM (08380500) streamgaging and water-quality monitoring station in August 2022 (watershed burned by Calf Canyon/Hermit Peak Fires April-August 2022) (photo showing Johanna Blake, USGS; photo by Jeannie Barlow, USGS)
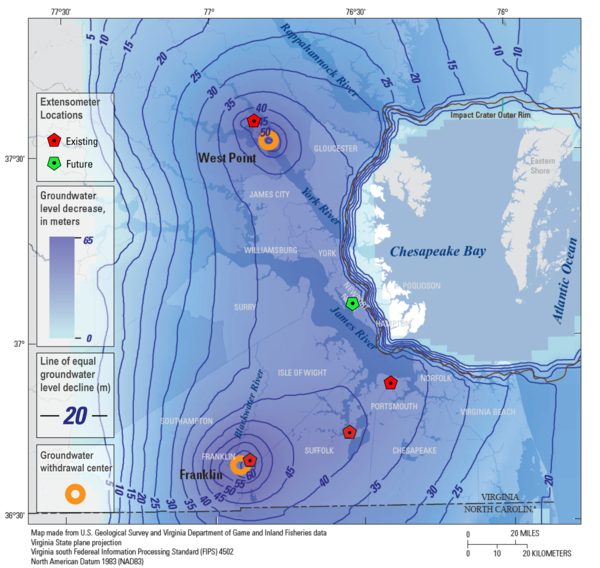
Virginia Extensometer Network
This map shows the locations of the four existing extensometers (red) in the USGS' Virginia Extensometer Network with the location of a fifth future extensometer (green). The basemap is of the Virginia Coastal Plain and shows the severity of groundwater depletion, with darker blue indicating greater groundwater depletion.
This map shows the locations of the four existing extensometers (red) in the USGS' Virginia Extensometer Network with the location of a fifth future extensometer (green). The basemap is of the Virginia Coastal Plain and shows the severity of groundwater depletion, with darker blue indicating greater groundwater depletion.

NextGen Update: Monitoring Location Pages & WaterAlert
NextGen Update: Monitoring Location Pages & WaterAlertThe thumbnail image for a video on NextGen Water Data for the Nation products.
NextGen Update: Monitoring Location Pages & WaterAlert
NextGen Update: Monitoring Location Pages & WaterAlertThe thumbnail image for a video on NextGen Water Data for the Nation products.

July 2022 Streamflow
A cartogram map of the US with proportional area charts for each state showing the proportion of streamgages by flow levels, categorized using percentile bins. Streamflow level percentiles are calculated using the historic daily record for each gage, and binned to reflect whether flow conditions are wetter or drier than the historical record.
A cartogram map of the US with proportional area charts for each state showing the proportion of streamgages by flow levels, categorized using percentile bins. Streamflow level percentiles are calculated using the historic daily record for each gage, and binned to reflect whether flow conditions are wetter or drier than the historical record.

U.S. River Conditions for April to June 2022 (video thumbnail)
U.S. River Conditions for April to June 2022 (video thumbnail)U.S. River Conditions, April to June 2022
U.S. River Conditions for April to June 2022 (video thumbnail)
U.S. River Conditions for April to June 2022 (video thumbnail)U.S. River Conditions, April to June 2022
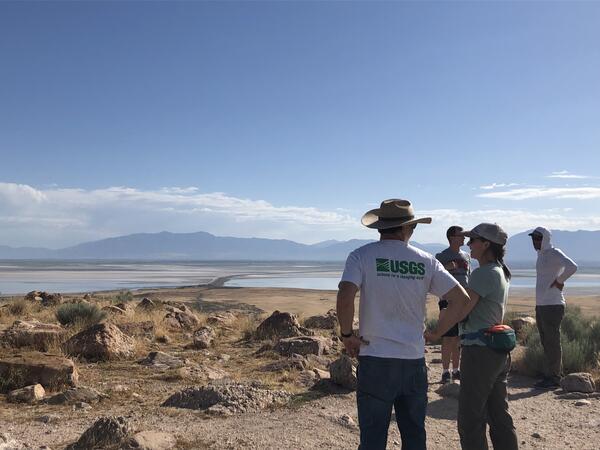
Scientist looking out onto the GSL from Antelope Island
Scientist looking out onto the GSL from Antelope IslandThese scientists are working on The Great Salt Lake to determine the amount of water and qualities of it. This will help them in developing better management techniques that will work to support the migratory birds that frequent the area.
By
Ecosystems Mission Area, Water Resources Mission Area, Species Management Research Program, Forest and Rangeland Ecosystem Science Center, Fort Collins Science Center, Nevada Water Science Center, Oregon Water Science Center, Utah Water Science Center, Western Ecological Research Center (WERC), Saline Lake Ecosystems Integrated Water Availability Assessment
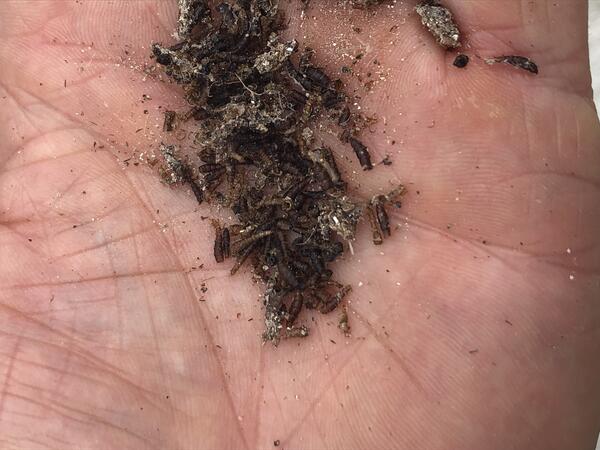
Brine fly pile
These brine flies are an important fuel source for migratory birds, giving them energy for long flights.
By
Ecosystems Mission Area, Water Resources Mission Area, Species Management Research Program, Forest and Rangeland Ecosystem Science Center, Nevada Water Science Center, Oregon Water Science Center, Utah Water Science Center, Western Ecological Research Center (WERC), Saline Lake Ecosystems Integrated Water Availability Assessment

June 2022 Streamflow
A cartogram map of the US with proportional area charts for each state showing the proportion of streamgages by flow levels, categorized using percentile bins. Streamflow level percentiles are calculated using the historic daily record for each gage, and binned to reflect whether flow conditions are wetter or drier than the historical record.
A cartogram map of the US with proportional area charts for each state showing the proportion of streamgages by flow levels, categorized using percentile bins. Streamflow level percentiles are calculated using the historic daily record for each gage, and binned to reflect whether flow conditions are wetter or drier than the historical record.
June 2022 USGS Active Groundwater Level Network Animation
June 2022 USGS Active Groundwater Level Network AnimationThe USGS Active Groundwater Level Network includes about 20,000 wells that have been measured by the USGS or USGS cooperators at least once within the past 13 months. The animation shows snapshots of water-level statistics in the network during June 2022.

USGS scientists test new method for microplastics analysis
USGS scientists test new method for microplastics analysisUSGS hydrologists and hydrologic technicians test a new method for collecting water from the Millstone River in Blackwells Mills, New Jersey. The new method helps measure microplastics concentrations using representative cross-section sampling. In the background, USGS staff maneuver a stainless-steel pump and tubing at pre-determined points along the river.

Piscatiquis River at Medford, Maine
A photograph taken near USGS 01034000 Piscataquis River at Medford, Maine on June 6, 2022 when the river was experiencing below average flow conditions as a result of a continued drought.
A photograph taken near USGS 01034000 Piscataquis River at Medford, Maine on June 6, 2022 when the river was experiencing below average flow conditions as a result of a continued drought.

Piscatiquis River near Dover-Foxcroft, Maine
A photograph of the Piscatquis River near Dover-Foxcroft, Maine taken on June 6, 2022, when the river was experiencing below average flow conditions due to a continued drought. USGS Current Conditions for USGS 01031500 Piscataquis River near Dover-Foxcroft, Maine
A photograph of the Piscatquis River near Dover-Foxcroft, Maine taken on June 6, 2022, when the river was experiencing below average flow conditions due to a continued drought. USGS Current Conditions for USGS 01031500 Piscataquis River near Dover-Foxcroft, Maine

Map showing helicopter survey area and near Granby, Colo.
Map showing helicopter survey area and near Granby, Colo.Map showing helicopter survey area and near Granby, Colo. Surveys will not occur directly above populated areas. Black circle indicates study area.
Map showing helicopter survey area and near Granby, Colo.
Map showing helicopter survey area and near Granby, Colo.Map showing helicopter survey area and near Granby, Colo. Surveys will not occur directly above populated areas. Black circle indicates study area.

Field Photo Friday image for 6.3.22, USGS gage 02172020, on the Cooper River at Pimlico, SC
Field Photo Friday image for 6.3.22, USGS gage 02172020, on the Cooper River at Pimlico, SCField Photo Friday image for 6.3.22, USGS gage 02172020, on the Cooper River at Pimlico, SC.
Field Photo Friday image for 6.3.22, USGS gage 02172020, on the Cooper River at Pimlico, SC
Field Photo Friday image for 6.3.22, USGS gage 02172020, on the Cooper River at Pimlico, SCField Photo Friday image for 6.3.22, USGS gage 02172020, on the Cooper River at Pimlico, SC.

May 2022 Streamflow
A cartogram map of the US with proportional area charts for each state showing the proportion of streamgages by flow levels, categorized using percentile bins. Streamflow level percentiles are calculated using the historic daily record for each gage, and binned to reflect whether flow conditions are wetter or drier than the historical record.
A cartogram map of the US with proportional area charts for each state showing the proportion of streamgages by flow levels, categorized using percentile bins. Streamflow level percentiles are calculated using the historic daily record for each gage, and binned to reflect whether flow conditions are wetter or drier than the historical record.

Drippy: Did you know? Evaporation & precipitation
Hey, I'm Drippy!