Puerto Rico’s North Coast Aqueduct interconnections
Puerto Rico’s North Coast Aqueduct interconnectionsLocations of Puerto Rico’s North Coast Aqueduct interconnections and water transferred, in million gallons per day (Mgal/d) in 2015.

Official websites use .gov
A .gov website belongs to an official government organization in the United States.
Secure .gov websites use HTTPS
A lock () or https:// means you’ve safely connected to the .gov website. Share sensitive information only on official, secure websites.
Explore water-related photography, imagery, and illustrations.

Locations of Puerto Rico’s North Coast Aqueduct interconnections and water transferred, in million gallons per day (Mgal/d) in 2015.
Locations of Puerto Rico’s North Coast Aqueduct interconnections and water transferred, in million gallons per day (Mgal/d) in 2015.

Graph of decadal change in Radium concentration compared to road salt application rate (Lindsay and others, 2021). Increases in concentrations of radium are correlated with road-salt application, and multiple lines of evidence support that the relation is causal.
Graph of decadal change in Radium concentration compared to road salt application rate (Lindsay and others, 2021). Increases in concentrations of radium are correlated with road-salt application, and multiple lines of evidence support that the relation is causal.

In this photo USGS hydrologist Allison Trcka collects a groundwater sample at the Idaho National Laboratory in November 2021. Since 1949, the USGS has partnered with the U.S.
In this photo USGS hydrologist Allison Trcka collects a groundwater sample at the Idaho National Laboratory in November 2021. Since 1949, the USGS has partnered with the U.S.

a) A thermal infrared orthomoasic image generated from drone-based data collected over a wetland in the Farmington River headwaters, Connecticut. The data indicate multi-scale preferential groundwater discharge processes.
a) A thermal infrared orthomoasic image generated from drone-based data collected over a wetland in the Farmington River headwaters, Connecticut. The data indicate multi-scale preferential groundwater discharge processes.

The USGS Active Groundwater Level Network includes about 20,000 wells that have been measured by the USGS or USGS cooperators at least once within the past 13 months. The animation shows snapshots of water-level statistics in the network during November 2021.
The USGS Active Groundwater Level Network includes about 20,000 wells that have been measured by the USGS or USGS cooperators at least once within the past 13 months. The animation shows snapshots of water-level statistics in the network during November 2021.

Screenshot of Nebraska water dashboard. This image was added to use as an example of a resource on the Nebraska Water Science Center Home page.
Screenshot of Nebraska water dashboard. This image was added to use as an example of a resource on the Nebraska Water Science Center Home page.
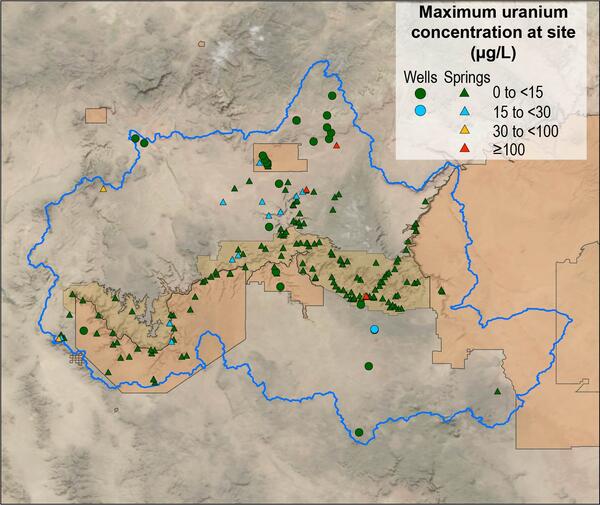
Map of maximum uranium concentration at 206 spring and well sites in the Grand Canyon region.
Map of maximum uranium concentration at 206 spring and well sites in the Grand Canyon region.

The USGS Active Groundwater Level Network includes about 20,000 wells that have been measured by the USGS or USGS cooperators at least once within the past 13 months. The animation shows snapshots of water-level statistics in the network during Octobers 2021.
The USGS Active Groundwater Level Network includes about 20,000 wells that have been measured by the USGS or USGS cooperators at least once within the past 13 months. The animation shows snapshots of water-level statistics in the network during Octobers 2021.

In this photo, USGS scientist Martha Nielsen conducts a slug test in a groundwater well completed in bedrock. During a slug test, a hydrologist causes the water level in a well to increase or decrease rapidly, while measuring the water-level response in the well over time.
In this photo, USGS scientist Martha Nielsen conducts a slug test in a groundwater well completed in bedrock. During a slug test, a hydrologist causes the water level in a well to increase or decrease rapidly, while measuring the water-level response in the well over time.

Photo Contest Winner | September 2021 | Honorable Mention 1
Kenna Grubb measuring on the Holston River
Photo Contest Winner | September 2021 | Honorable Mention 1
Kenna Grubb measuring on the Holston River

Ruby Lake National Wildlife Refuge lies at the southern end of Ruby Valley in northeast Nevada. For more information visit the Ruby Lake NWR website.
Ruby Lake National Wildlife Refuge lies at the southern end of Ruby Valley in northeast Nevada. For more information visit the Ruby Lake NWR website.

The USGS Active Groundwater Level Network includes about 20,000 wells that have been measured by the USGS or USGS cooperators at least once within the past 13 months. The animation shows snapshots of water-level statistics in the network during September 2021.
The USGS Active Groundwater Level Network includes about 20,000 wells that have been measured by the USGS or USGS cooperators at least once within the past 13 months. The animation shows snapshots of water-level statistics in the network during September 2021.

Hurricane Ida made landfall as a Category 4 hurricane in Louisiana, and brought widespread precipitation and flooding along its path and up the northeastern coast of U.S. in the following week.
Hurricane Ida made landfall as a Category 4 hurricane in Louisiana, and brought widespread precipitation and flooding along its path and up the northeastern coast of U.S. in the following week.

The USGS Active Groundwater Level Network includes about 20,000 wells that have been measured by the USGS or USGS cooperators at least once within the past 13 months. The animation shows snapshots of water-level statistics in the network during August 2021.
The USGS Active Groundwater Level Network includes about 20,000 wells that have been measured by the USGS or USGS cooperators at least once within the past 13 months. The animation shows snapshots of water-level statistics in the network during August 2021.

Photo Contest Winner | September 2021 | Honorable Mention 2
Liz Nystrom captaining a boat on the Hudson River
Photo Contest Winner | September 2021 | Honorable Mention 2
Liz Nystrom captaining a boat on the Hudson River

An animated map of tropical storm Henri that made landfall in Rhode Island on Sunday, August 22, 2021. The map shows the east coast of the United States from Maryland to Maine, with the storm path traveling from the Atlantic Ocean north to make land in Rhode Island.
An animated map of tropical storm Henri that made landfall in Rhode Island on Sunday, August 22, 2021. The map shows the east coast of the United States from Maryland to Maine, with the storm path traveling from the Atlantic Ocean north to make land in Rhode Island.

Photo looking downstream from the Pack Creek Road Bridge shows the rain gage on top with a USGS sticker. Below is a solar panel for power. The other white round object contains the data logger and satellite antenna.
Photo looking downstream from the Pack Creek Road Bridge shows the rain gage on top with a USGS sticker. Below is a solar panel for power. The other white round object contains the data logger and satellite antenna.

Photo Contest Winner | September 2021 | USGS at Work
USGS Research Hyrologist Neil Terry preparing for resistivity surveys in Northern Minnesota
Photo Contest Winner | September 2021 | USGS at Work
USGS Research Hyrologist Neil Terry preparing for resistivity surveys in Northern Minnesota
The USGS Active Groundwater Level Network includes about 20,000 wells that have been measured by the USGS or USGS cooperators at least once within the past 13 months. The animation shows snapshots of water-level statistics in the network during July 2021.
The USGS Active Groundwater Level Network includes about 20,000 wells that have been measured by the USGS or USGS cooperators at least once within the past 13 months. The animation shows snapshots of water-level statistics in the network during July 2021.

Photo Contest Winner | September 2021 | Where We Work
Chany Huddleston and Ross Clyma prepare QBoat at Schoharie Creek
Photo Contest Winner | September 2021 | Where We Work
Chany Huddleston and Ross Clyma prepare QBoat at Schoharie Creek

USGS hydrologic technician Travis Gibson confirms Great Salt Lake water levels at the SaltAire gauge.
USGS hydrologic technician Travis Gibson confirms Great Salt Lake water levels at the SaltAire gauge.