
Two hydrologists rinsing materials from a microplastics collection chamber into a glass jar that is sent to the lab for analysis.
Images
Explore water-related photography, imagery, and illustrations.
Filter Total Items: 2584
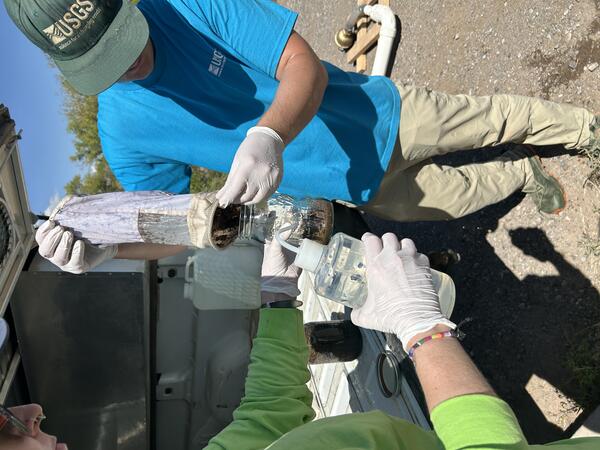
Microplastic Sample chamber
Two hydrologists rinsing materials from a microplastics collection chamber into a glass jar that is sent to the lab for analysis.
Net Sampler Rio Grande
USGS hydrologists conducting microplastics sampling using the ‘in-stream-net’ method.
USGS hydrologists conducting microplastics sampling using the ‘in-stream-net’ method.

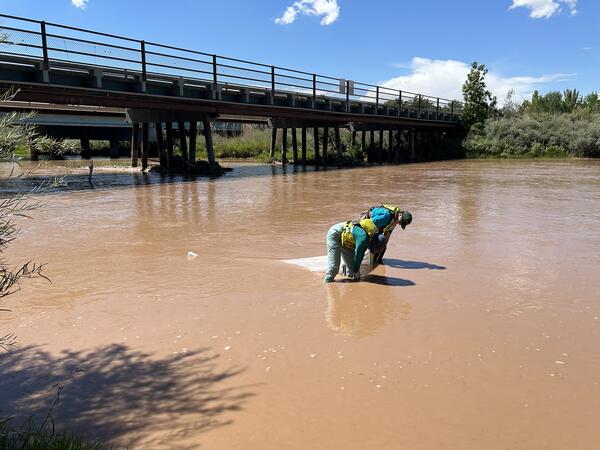
Team Microplastics Sampling Alameda.jpg
USGS team members preparing to sample the Rio Grande near Alameda (USGS-08329918) in fall 2024 for microplastics using the ‘pump-sampler’ method.
USGS team members preparing to sample the Rio Grande near Alameda (USGS-08329918) in fall 2024 for microplastics using the ‘pump-sampler’ method.
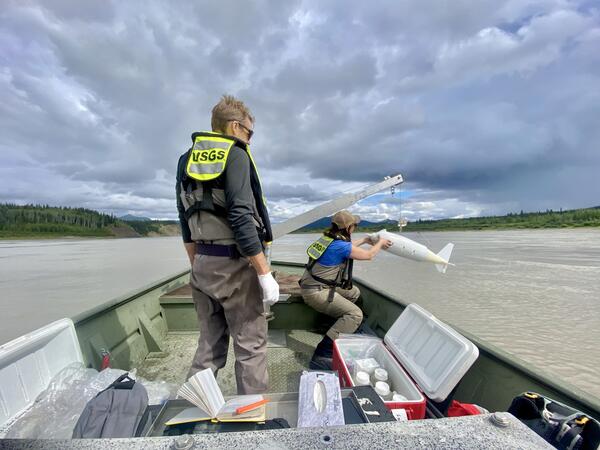
USGS staff collecting water quality samples on the Yukon River at Eagle
USGS staff collecting water quality samples on the Yukon River at EagleUSGS staff sample the Yukon River for cyanide after a heap leach failure occurred upstream at the Eagle Gold Mine in the Yukon, Canada.
USGS staff collecting water quality samples on the Yukon River at Eagle
USGS staff collecting water quality samples on the Yukon River at EagleUSGS staff sample the Yukon River for cyanide after a heap leach failure occurred upstream at the Eagle Gold Mine in the Yukon, Canada.
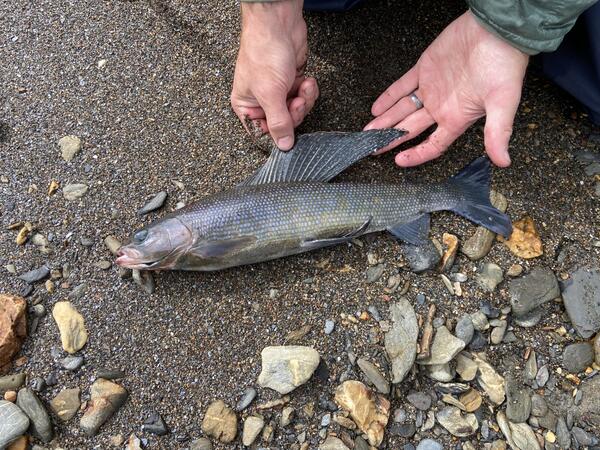
Arctic Grayling (Thymallus arctus) caught in the Nakolikuruk River near an orange tributary, Noatak National Preserve, Alaska
Arctic Grayling (Thymallus arctus) caught in the Nakolikuruk River near an orange tributary, Noatak National Preserve, AlaskaOrange streams are increasingly common in the Brooks Range of northern Alaska. The orange stream color reflects oxidized iron, but also often indicates elevated heavy metal concentrations. Our ongoing study aims to document these occurrences and the timing of their onset.
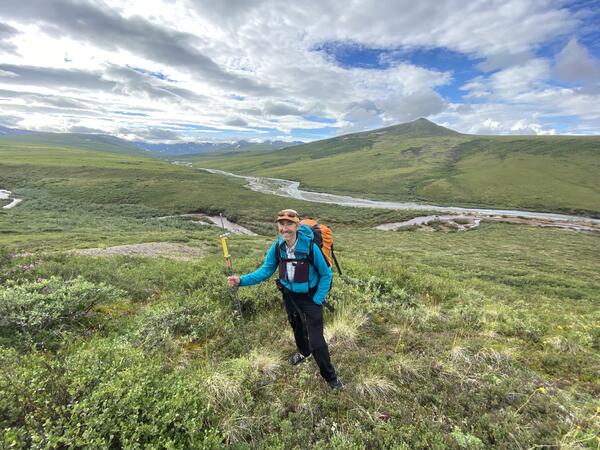
Surveying for "rusting rivers" in the Nakolikurok Creek watershed, Noatak National Preserve, Alaska
Surveying for "rusting rivers" in the Nakolikurok Creek watershed, Noatak National Preserve, AlaskaOrange streams are increasingly common in the Brooks Range of northern Alaska. The orange stream color reflects oxidized iron, but also often indicates elevated heavy metal concentrations. Our ongoing study aims to document these occurrences and the timing of their onset.
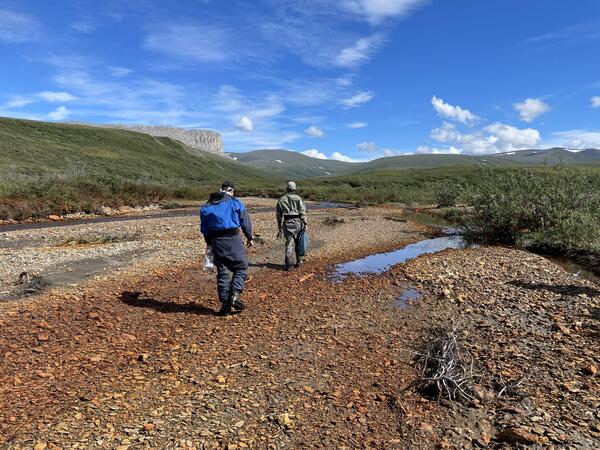
Researchers walking to a site to sample rusting in the Nakolikurok Creek Watershed
Researchers walking to a site to sample rusting in the Nakolikurok Creek WatershedOrange streams are increasingly common in the Brooks Range of northern Alaska. The orange stream color reflects oxidized iron, but also often indicates elevated heavy metal concentrations. Our ongoing study aims to document these occurrences and the timing of their onset.

Researchers following orange staining up the braidplain of the Nakolikurok Creek
Researchers following orange staining up the braidplain of the Nakolikurok CreekOrange streams are increasingly common in the Brooks Range of northern Alaska. The orange stream color reflects oxidized iron, but also often indicates elevated heavy metal concentrations. Our ongoing study aims to document these occurrences and the timing of their onset.
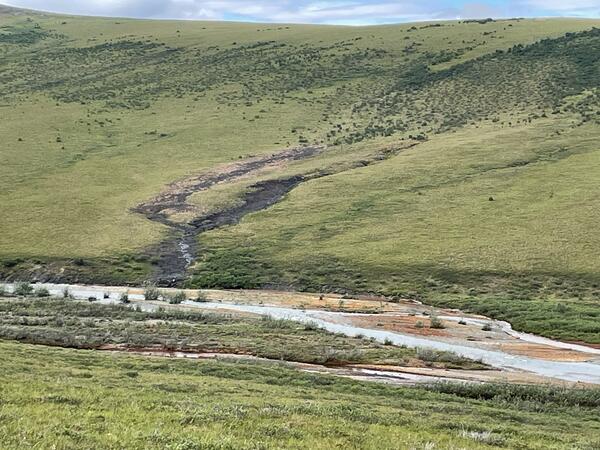
A seep emanates from a hillslope in the Nakolikurok Creek Watershed, blackening vegetation and staining the streambanks orange
A seep emanates from a hillslope in the Nakolikurok Creek Watershed, blackening vegetation and staining the streambanks orangeOrange streams are increasingly common in the Brooks Range of northern Alaska. The orange stream color reflects oxidized iron, but also often indicates elevated heavy metal concentrations. Our ongoing study aims to document these occurrences and the timing of their onset.
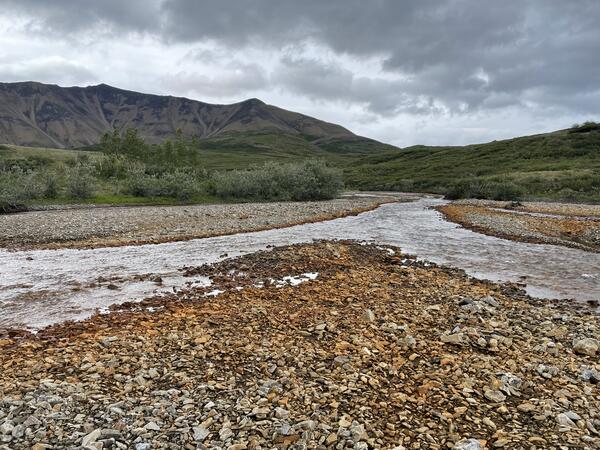
Orange staining in the braidplain of the Nakolikurok Creek
Orange staining in the braidplain of the Nakolikurok CreekOrange streams are increasingly common in the Brooks Range of northern Alaska. The orange stream color reflects oxidized iron, but also often indicates elevated heavy metal concentrations. Our ongoing study aims to document these occurrences and the timing of their onset.

New USGS Hydrologic Instrumentation Facility in Tuscaloosa, Alabama
New USGS Hydrologic Instrumentation Facility in Tuscaloosa, AlabamaThe new Hydrologic Instrumentation Facility (HIF) on the University of Alabama Campus at Tuscaloosa, AL. The new facility is a national USGS capability that includes:
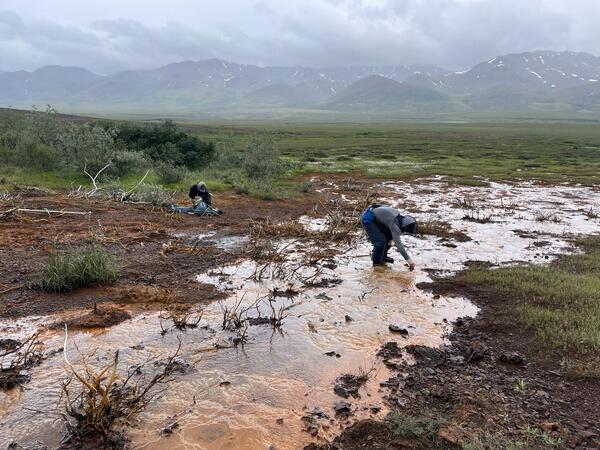
Two scientists sample the orange water of a seep in the Kelly River Watershed, Alaska
Two scientists sample the orange water of a seep in the Kelly River Watershed, AlaskaOrange streams are increasingly common in the Brooks Range of northern Alaska. The orange stream color reflects oxidized iron, but also often indicates elevated heavy metal concentrations. Our ongoing study aims to document these occurrences and the timing of their onset.
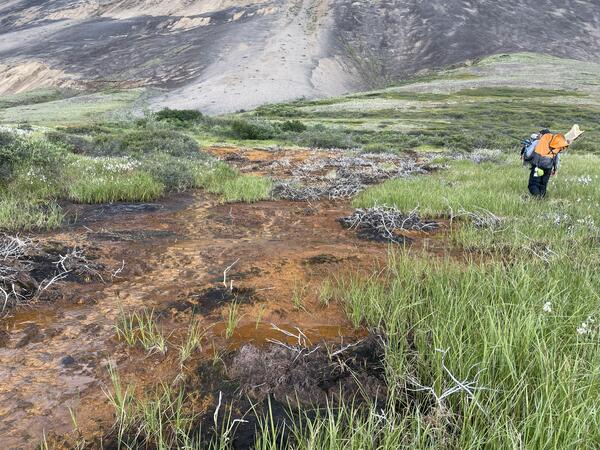
A scientist walks uphill towards the source of an orange seep
A scientist walks uphill towards the source of an orange seepOrange streams are increasingly common in the Brooks Range of northern Alaska. The orange stream color reflects oxidized iron, but also often indicates elevated heavy metal concentrations. Our ongoing study aims to document these occurrences and the timing of their onset.
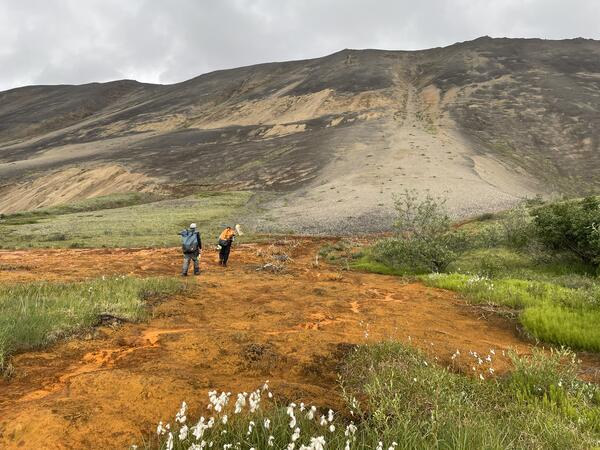
Two scientists investigating the source of an orange seep
Two scientists investigating the source of an orange seepOrange streams are increasingly common in the Brooks Range of northern Alaska. The orange stream color reflects oxidized iron, but also often indicates elevated heavy metal concentrations. Our ongoing study aims to document these occurrences and the timing of their onset.
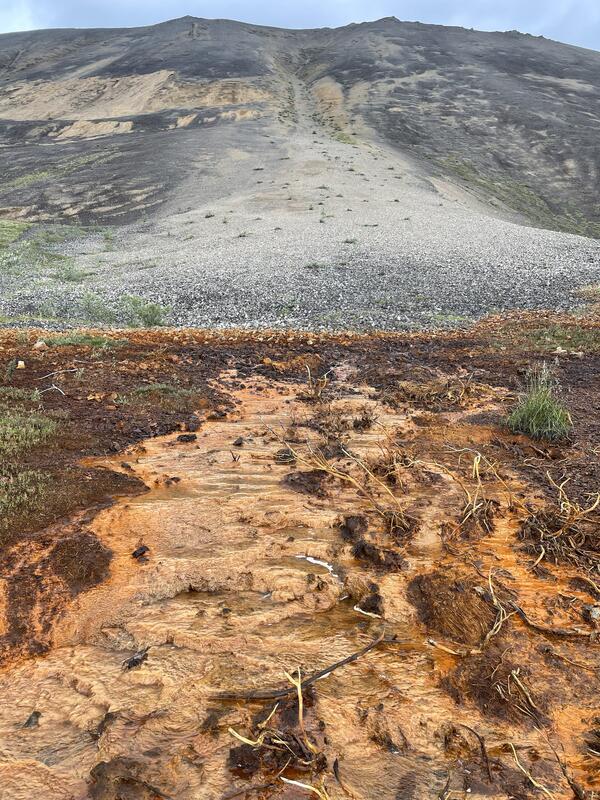
Orange staining and blackened vegetation where a seep emerges from a debris fan
Orange staining and blackened vegetation where a seep emerges from a debris fanOrange streams are increasingly common in the Brooks Range of northern Alaska. The orange stream color reflects oxidized iron, but also often indicates elevated heavy metal concentrations. Our ongoing study aims to document these occurrences and the timing of their onset.
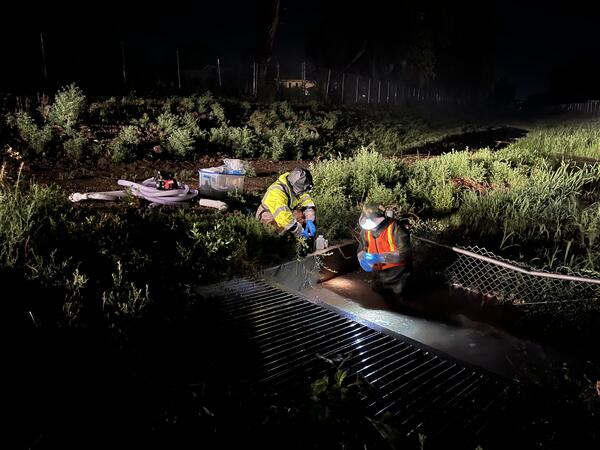
ABQ_Night_Sampling
USGS employees surface water sampling during evening monsoon storm in July 2024 at Adobe Acres Inflow at Albuquerque, New Mexico – USGS-350100106410810.
USGS employees surface water sampling during evening monsoon storm in July 2024 at Adobe Acres Inflow at Albuquerque, New Mexico – USGS-350100106410810.
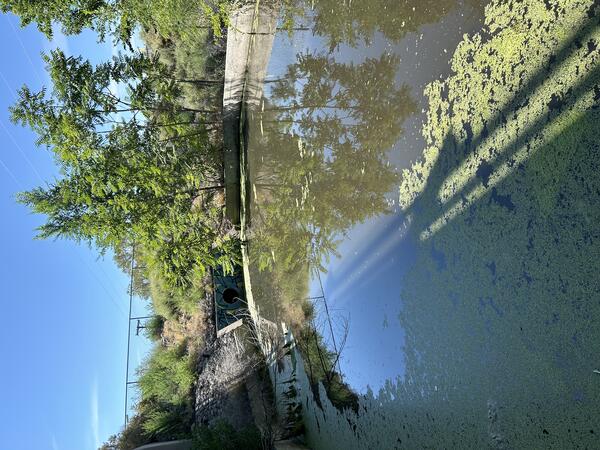
OutfallAlameda_w-Algae
Photograph of stormwater outfall sampling location, Alameda Pump Station Outflow – USGS-351146106382801
Photograph of stormwater outfall sampling location, Alameda Pump Station Outflow – USGS-351146106382801

Tilting flume in the USGS Hydrologic Instrumentation Facility's new hydraulics laboratory
Tilting flume in the USGS Hydrologic Instrumentation Facility's new hydraulics laboratoryView of tilting flume from the catwalk above the hydraulics laboratory at the USGS Hydrologic Instrumentation Facility.
Tilting flume in the USGS Hydrologic Instrumentation Facility's new hydraulics laboratory
Tilting flume in the USGS Hydrologic Instrumentation Facility's new hydraulics laboratoryView of tilting flume from the catwalk above the hydraulics laboratory at the USGS Hydrologic Instrumentation Facility.

Walk-in temperature chamber at the USGS Hydrologic Instrumentation Facility
Walk-in temperature chamber at the USGS Hydrologic Instrumentation FacilityPerson standing inside the walk-in temperature chamber at the Hydrologic Instrumentation Facility.
Walk-in temperature chamber at the USGS Hydrologic Instrumentation Facility
Walk-in temperature chamber at the USGS Hydrologic Instrumentation FacilityPerson standing inside the walk-in temperature chamber at the Hydrologic Instrumentation Facility.

Wet chemistry lab at the USGS Hydrologic Instrumentation Facility
Wet chemistry lab at the USGS Hydrologic Instrumentation FacilityWet chemistry lab under construction at the USGS Hydrologic Instrumentation Facility.
Wet chemistry lab at the USGS Hydrologic Instrumentation Facility
Wet chemistry lab at the USGS Hydrologic Instrumentation FacilityWet chemistry lab under construction at the USGS Hydrologic Instrumentation Facility.

Hydraulics lab at the USGS Hydrologic Instrumentation Facility
Hydraulics lab at the USGS Hydrologic Instrumentation FacilityThe hydraulics lab at the USGS Hydrologic Instrumentation Facility, complete with tow tank, tilting flume, and wave-generating test basin, near completion in June 2024.
Hydraulics lab at the USGS Hydrologic Instrumentation Facility
Hydraulics lab at the USGS Hydrologic Instrumentation FacilityThe hydraulics lab at the USGS Hydrologic Instrumentation Facility, complete with tow tank, tilting flume, and wave-generating test basin, near completion in June 2024.