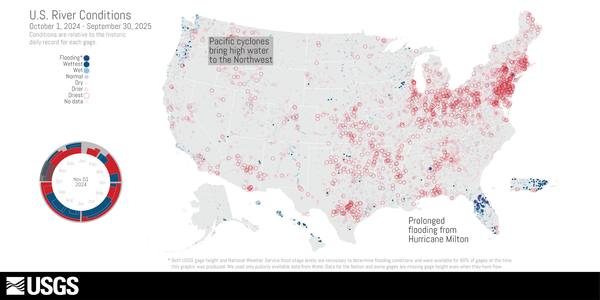
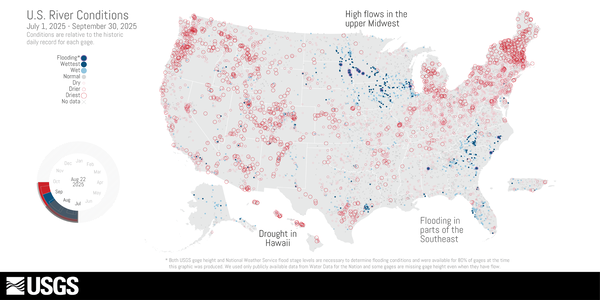
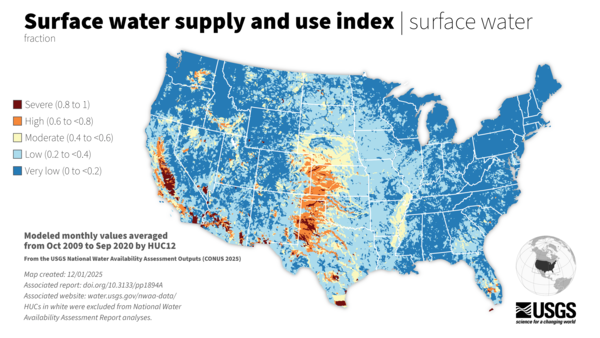
At the USGS, we monitor our nation’s water. Our data informs many people, from kayakers to water managers. Gage Greatness allows any Instagram user to vote for their favorite gage (data collection station).
Images
Explore water-related photography, imagery, and illustrations.
At the USGS, we monitor our nation’s water. Our data informs many people, from kayakers to water managers. Gage Greatness allows any Instagram user to vote for their favorite gage (data collection station).
Screenshot from Water Data for the Nation video on "How to make a current conditions table using new state pages and My Favorites list"
WDFN: How to Show Daily Values on Monitoring Location Pages
WDFN: How to Show Daily Values on Monitoring Location PagesWater Data for the Nation: How to Show Daily Values on Monitoring Location Pages video thumbnail
WDFN: How to Show Daily Values on Monitoring Location Pages
WDFN: How to Show Daily Values on Monitoring Location PagesWater Data for the Nation: How to Show Daily Values on Monitoring Location Pages video thumbnail
USGS hydrologic technician Fred Brogan holds an acoustic doppler current profiler (ADCP) while measuring the highest flow measured to-date on Hurricane Creek at Hurricane, WV. Photo by Logan Jarrell, USGS Hydrologic Technician
Thumbnail for the National Water Availability Assessment Release
Thumbnail for the National Water Availability Assessment ReleaseThumbnail image for the Water Resources Mission Area National Water Availability Assessment Release
Thumbnail for the National Water Availability Assessment Release
Thumbnail for the National Water Availability Assessment ReleaseThumbnail image for the Water Resources Mission Area National Water Availability Assessment Release
Thumbnail of Introductory slide for USGS Water Resources Mission Area public webinar, NWISWEB Decommission – Campaign 1
Thumbnail of Introductory slide for USGS Water Resources Mission Area public webinar, NWISWEB Decommission – Campaign 1Thumbnail of Introductory slide for USGS Water Resources Mission Area public webinar, NWISWEB Decommission – Campaign 1.
Graphs showing water-year total precipitation and air temperatures in the Lower Colorado River Basin from 1896 to 2019
Graphs showing water-year total precipitation and air temperatures in the Lower Colorado River Basin from 1896 to 2019Graphs showing water-year total precipitation and air temperatures in the Lower Colorado River Basin from 1896 to 2019, units modified from millimeters to inches of precipitation and from degrees Celsius to degrees Fahrenheit from: Tillman, F.D., Gangopadhyay, S., and Pruitt, T., 2020, Trends in recent historical and projected climate data for the Colorado River Bas
U.S. River Conditions, October to December 2024 thumbnail image. The river conditions shown range from the driest condition seen at a gage (red open circles) to the wettest (blue closed circles). A purple outer ring around a gage indicates it is flooding.
Pie chart showing proportions of major water use in Arizona in 2015
Pie chart showing proportions of major water use in Arizona in 2015Pie chart showing proportions of major water uses (Agricultural, Municipal, Industrial, and Mining) in Arizona, USA, in 2015
Pie chart showing proportions of major water use in Arizona in 2015
Pie chart showing proportions of major water use in Arizona in 2015Pie chart showing proportions of major water uses (Agricultural, Municipal, Industrial, and Mining) in Arizona, USA, in 2015
USGS hydrologic technicians collect water-quality samples on the Mississippi River (USGS monitoring location 322023090544500 Mississippi River Above Vicksburg at Mile 438, MS).
Temperature logger attached to submerged cobble in Quartzville Creek, OR. This logger was placed as part of an ongoing effort to retrieve continuous temperature data from rivers and tributaries within the Willamette River basin, OR.
Cinnamon teal with a GPS tracking backpack that weighs 10 grams, making it much more successful in staying on longer than heavier tracking devices.
Alton Anderson of the USGS explaining common geophysical tools used to evaluate boreholes to a group of people at a worksite.
Map of New York State showing the three pilot study areas for interactive products to assist with geothermal drilling.
The three Integrated Water Availability Assessment products are designed to be interdependent:
Water limitation across the lower 48 United States, shown as the average from 2010 to 2020 for each watershed (HUC12). Water limitation levels were based on the surface water supply and use index, which expresses the imbalance between surface water-supply and consumptive use.
This is a thumbnail for an animation showing the changing conditions relative to the historic record of USGS streamgages from October 1, 2023 - September 30, 2024. The river conditions shown range from the driest condition seen at a gage (red open circles) to the wettest (blue closed circles).
Thumbnail image for a promotional video about the USGS Hydrologic Instrumentation Facility in Tuscaloosa, Alabama.
Thumbnail image for a promotional video about the USGS Hydrologic Instrumentation Facility in Tuscaloosa, Alabama.Large text reads, “Hydrologic Instrumentation Facility: A new era for water science and technology.” Text sits over an aerial image of the Hydrologic Instrumentation Facility (HIF), with the tree-lined Black Warrior River visible in the background.
Hydrologic Instrumentation Facility: A new era for water science and technology
Hydrologic Instrumentation Facility: A new era for water science and technologyLarge text reads, “Hydrologic Instrumentation Facility: A new era for water science and technology.” Text sits over an aerial image of the Hydrologic Instrumentation Facility, with the tree-lined Black Warrior River visible in the background.
Probability for PFAS in groundwater at the depth of public drinking water supply
Probability for PFAS in groundwater at the depth of public drinking water supplyUSGS national estimates of the probability for PFAS in groundwater at the depth of public drinking water supply. Read the associated USGS study at https://doi.org/10.1126/science.ado6638.
Probability for PFAS in groundwater at the depth of private drinking water supply
Probability for PFAS in groundwater at the depth of private drinking water supplyUSGS national estimates of the probability for PFAS in groundwater at the depth of private drinking water supply. Read the associated USGS study at https://doi.org/10.1126/science.ado6638.