
The three Integrated Water Availability Assessment products are designed to be interdependent:
Images
Explore water-related photography, imagery, and illustrations.
Filter Total Items: 2584

IWAAs product interdependencies (Media Item)
The three Integrated Water Availability Assessment products are designed to be interdependent:

IWAAs - levels of water limitations
Water limitation across the lower 48 United States, shown as the average from 2010 to 2020 for each watershed (HUC12). Water limitation levels were based on the surface water supply and use index, which expresses the imbalance between surface water-supply and consumptive use.
Water limitation across the lower 48 United States, shown as the average from 2010 to 2020 for each watershed (HUC12). Water limitation levels were based on the surface water supply and use index, which expresses the imbalance between surface water-supply and consumptive use.

U.S. River Conditions for Water Year 2024
This is a thumbnail for an animation showing the changing conditions relative to the historic record of USGS streamgages from October 1, 2023 - September 30, 2024. The river conditions shown range from the driest condition seen at a gage (red open circles) to the wettest (blue closed circles).
This is a thumbnail for an animation showing the changing conditions relative to the historic record of USGS streamgages from October 1, 2023 - September 30, 2024. The river conditions shown range from the driest condition seen at a gage (red open circles) to the wettest (blue closed circles).

Thumbnail image for a promotional video about the USGS Hydrologic Instrumentation Facility in Tuscaloosa, Alabama.
Thumbnail image for a promotional video about the USGS Hydrologic Instrumentation Facility in Tuscaloosa, Alabama.Large text reads, “Hydrologic Instrumentation Facility: A new era for water science and technology.” Text sits over an aerial image of the Hydrologic Instrumentation Facility (HIF), with the tree-lined Black Warrior River visible in the background.

Hydrologic Instrumentation Facility: A new era for water science and technology
Hydrologic Instrumentation Facility: A new era for water science and technologyLarge text reads, “Hydrologic Instrumentation Facility: A new era for water science and technology.” Text sits over an aerial image of the Hydrologic Instrumentation Facility, with the tree-lined Black Warrior River visible in the background.

Probability for PFAS in groundwater at the depth of public drinking water supply
Probability for PFAS in groundwater at the depth of public drinking water supplyUSGS national estimates of the probability for PFAS in groundwater at the depth of public drinking water supply. Read the associated USGS study at https://doi.org/10.1126/science.ado6638.

Probability for PFAS in groundwater at the depth of private drinking water supply
Probability for PFAS in groundwater at the depth of private drinking water supplyUSGS national estimates of the probability for PFAS in groundwater at the depth of private drinking water supply. Read the associated USGS study at https://doi.org/10.1126/science.ado6638.

U.S. River Conditions, July to September 2024
U.S. River Conditions, July to September 2024 thumbnail image. The river conditions shown range from the driest condition seen at a gage (red open circles) to the wettest (blue closed circles). A purple outer ring around a gage indicates it is flooding.
U.S. River Conditions, July to September 2024 thumbnail image. The river conditions shown range from the driest condition seen at a gage (red open circles) to the wettest (blue closed circles). A purple outer ring around a gage indicates it is flooding.

Schematic Diagram of Water Flow for Conventional Flotation Processing of Copper Ores (Bleiwas, 2012)
Schematic Diagram of Water Flow for Conventional Flotation Processing of Copper Ores (Bleiwas, 2012)Schematic diagram of water flow for conventional flotation processing of copper ores from Bleiwas, D.I., 2012, Estimated water requirements for the conventional flotation of copper ores: U.S. Geological Survey Open-File Report 2012–1089, 13 p., available at https://pubs.usgs.gov/publication/ofr20121089

Aftermath of severe flooding on Pigeon River in Newport, Tennessee
Aftermath of severe flooding on Pigeon River in Newport, TennesseeUSGS Hydrologic Technician Pamela Loftin looks on at the aftermath of severe flooding on Pigeon River in Newport, Tennessee. USGS crews were onsite October 1 to measure high-water marks to determine how high the flood waters reached at this location. Photo by Logan Combs, USGS.

Water Cycle Image.jpg
This image shows the cloud-water interception process in an island environment like the Hawaiian islands.
This image shows the cloud-water interception process in an island environment like the Hawaiian islands.

Mean atmospheric precipitation and air temperature in the Lower Colorado River Basin, 1896-2019
Mean atmospheric precipitation and air temperature in the Lower Colorado River Basin, 1896-2019Graphs showing mean annual precipitation and air temperature trends in the Lower Colorado River Basin, 1896-2019, published in: Tillman, F.D., Gangopadhyay, S., and Pruitt, T., 2020, Trends in recent historical and projected climate data for the Colorado River Basin and potential effects on groundwater availability: U.S.

Map of Colorado River Basin
Map of the Colorado River Basin in Wyoming, Colorado, Utah, Nevada, California, Arizona, and New Mexico
Map of the Colorado River Basin in Wyoming, Colorado, Utah, Nevada, California, Arizona, and New Mexico
Underside of Bell Jet Helicopter with thermal infrared and true-color image sensors and JN and M.D.
Underside of Bell Jet Helicopter with thermal infrared and true-color image sensors and JN and M.D.Underside of Bell Jet Helicopter with thermal infrared and true-color image sensors and JN and M.D. The helicopter is used for airborne surveys of river reaches to capture temperature values of water-surfaces.
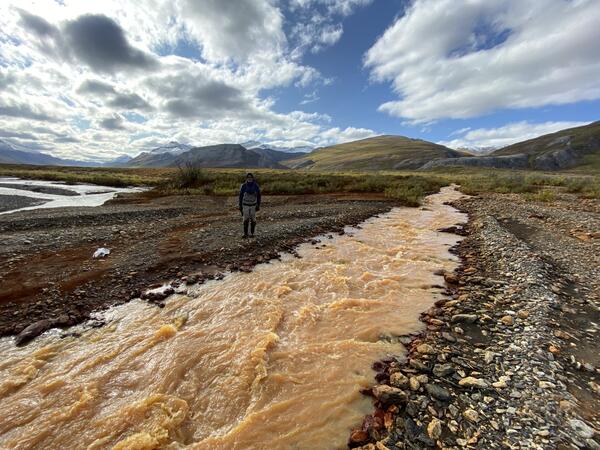
Orange staining in a side channel of the Nakolikurok Creek
Orange staining in a side channel of the Nakolikurok CreekOrange streams are increasingly common in the Brooks Range of northern Alaska. The orange stream color reflects oxidized iron, but also often indicates elevated heavy metal concentrations. Our ongoing study aims to document these occurrences and the timing of their onset.
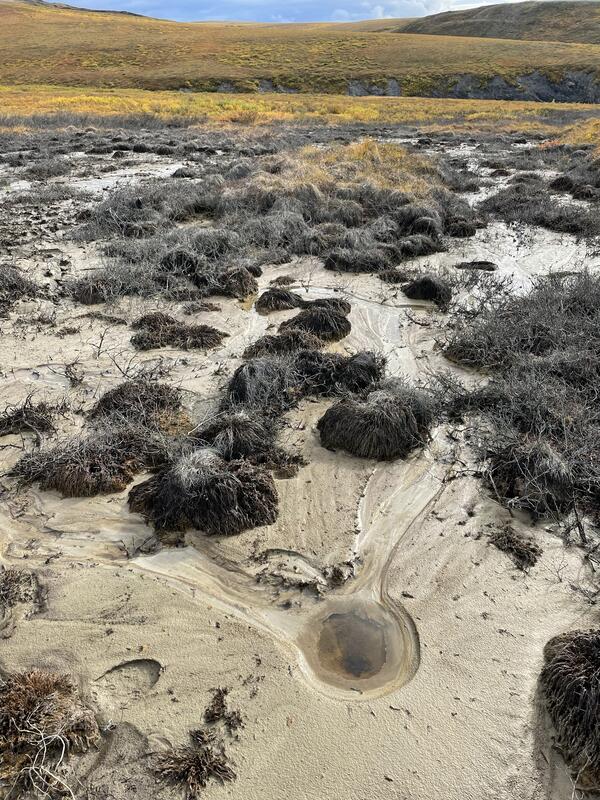
Emergence of acidic waters from a seep in the Agashashok River Watershed
Emergence of acidic waters from a seep in the Agashashok River WatershedOrange streams are increasingly common in the Brooks Range of northern Alaska. The orange stream color reflects oxidized iron, but also often indicates elevated heavy metal concentrations. Our ongoing study aims to document these occurrences and the timing of their onset.
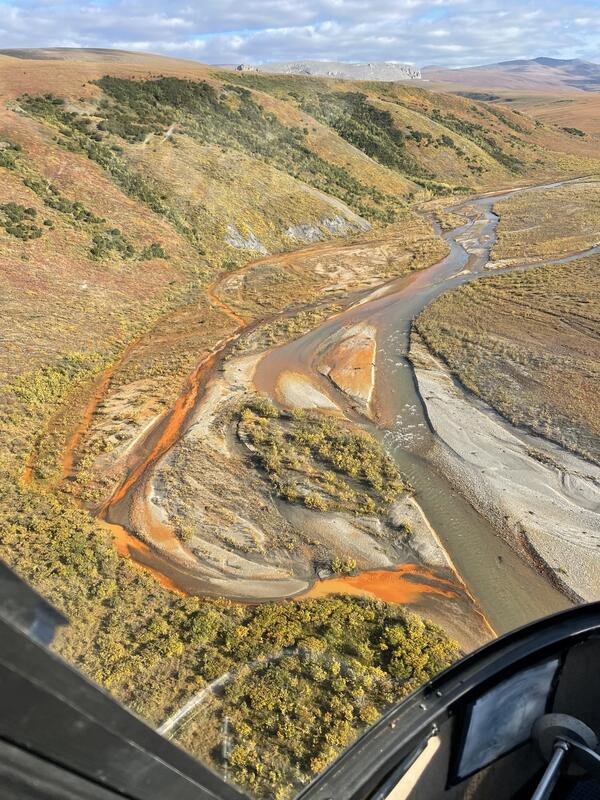
An orange tributary of the Igning River, Gates of the Arctic National Park and Preserve, Alaska
An orange tributary of the Igning River, Gates of the Arctic National Park and Preserve, AlaskaOrange streams are increasingly common in the Brooks Range of northern Alaska. The orange stream color reflects oxidized iron, but also often indicates elevated heavy metal concentrations. Our ongoing study aims to document these occurrences and the timing of their onset.

Lower Colorado Basin Precipitation Temperature 1896-2019_graph.jpg
Lower Colorado Basin Precipitation Temperature 1896-2019_graph.jpgGraphs showing trends in atmospheric precipitation and air temperature in the Lower Colorado River Basin, 1896-2019
Lower Colorado Basin Precipitation Temperature 1896-2019_graph.jpg
Lower Colorado Basin Precipitation Temperature 1896-2019_graph.jpgGraphs showing trends in atmospheric precipitation and air temperature in the Lower Colorado River Basin, 1896-2019

Diagram of water flow through a copper ore flotation plant and unlined tailings storage facility
Diagram of water flow through a copper ore flotation plant and unlined tailings storage facilitySchematic diagram of water flow through a conventional copper-ore flotation plant and unlined tailings storage facility illustrating water losses (in italics), reclamation of process water, and addition of makeup water.
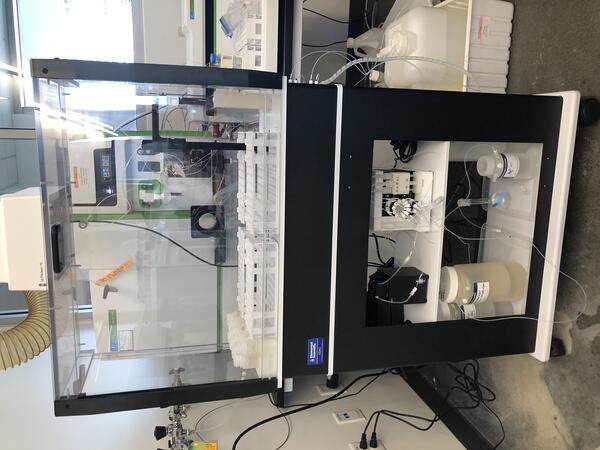
Inductively Coupled Plasma Mass Spectrometry Equipment
Inductively Coupled Plasma Mass Spectrometry EquipmentThe Selenium Bioaccumulation and Contaminant Research Laboratory's Inductively Coupled Plasma Mass Spectrometry (ICP-MS) set up for low mass, low concentration selenium analyses of most matrixes using hydride generation-isotope dilution-inductively coupled plasma-mass spectrometry (HG-ID-ICP-MS).

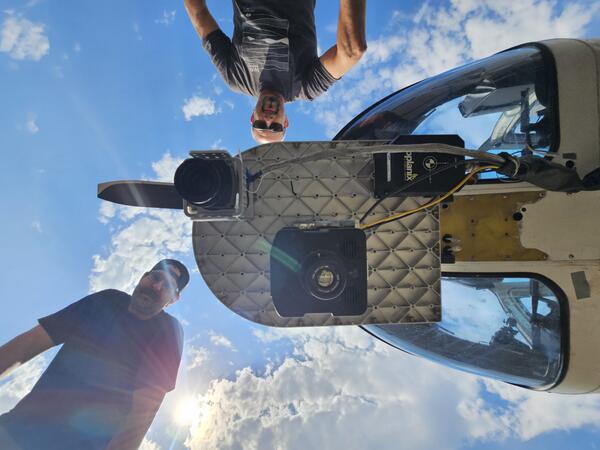
View of nose of Bell Jet Helicopter with a thermal infrared and true-color sensor co-mounted to the underside
View of nose of Bell Jet Helicopter with a thermal infrared and true-color sensor co-mounted to the undersideProfile view of a Bell Jet Helicopter with a thermal infrared and true-color sensor co-mounted to the underside of the nose. These sensors are used in airborne thermal infrared surveys for remotely sensing land/water surface temperature.