U.S. flag

An official website of the United States government

Images

Explore water-related photography, imagery, and illustrations.

Filter Total Items: 2584
2025 Gage Greatness Final Bracket

At the USGS, we monitor our nation’s water. Our data informs many people, from kayakers to water managers. Gage Greatness allows any Instagram user to vote for their favorite gage (data collection station).

At the USGS, we monitor our nation’s water. Our data informs many people, from kayakers to water managers. Gage Greatness allows any Instagram user to vote for their favorite gage (data collection station).

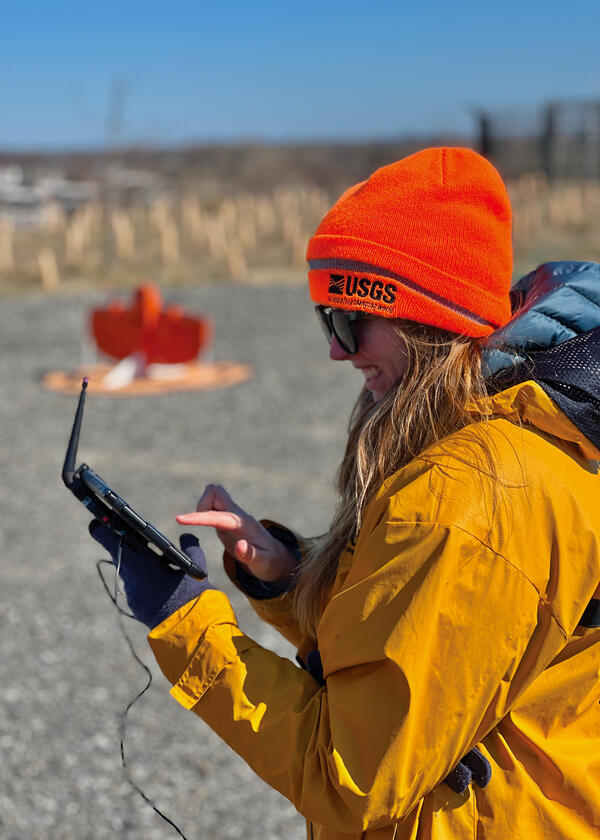
Researcher prepares a wingtra lidar flight at the Darby Creek landfill Superfund site
Researcher prepares a wingtra lidar flight

Jennifer Cramer is preparing a wingtra lidar flight at the Darby Creek landfill Superfund site (Philadelphia skyline is visible on the horizon) on March 27, 2025.  sUAS, also known as a drone, is being used to model morphological changes in the tidal creek and adjacent landfill with lidar sensors, potential contaminated groundwater seeps are identified using th

Jennifer Cramer is preparing a wingtra lidar flight at the Darby Creek landfill Superfund site (Philadelphia skyline is visible on the horizon) on March 27, 2025.  sUAS, also known as a drone, is being used to model morphological changes in the tidal creek and adjacent landfill with lidar sensors, potential contaminated groundwater seeps are identified using th

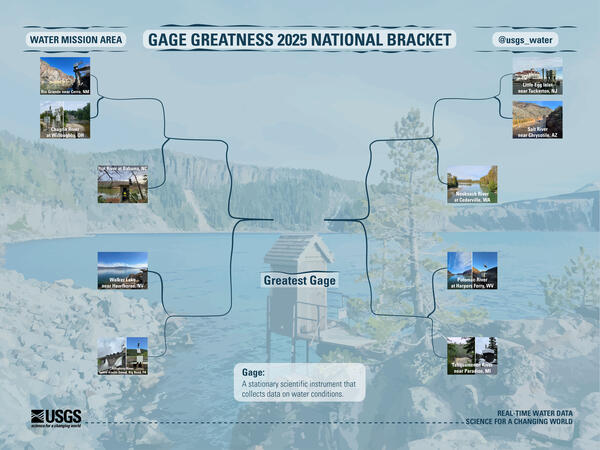
Gage Greatness 2025 Final National Bracket
Gage Greatness 2025 Finals bracket

The bracket for the Finals! New Jersey's and New Mexico's gages will compete to see whose gage is the greatest for Gage Greatest 2025.

The bracket for the Finals! New Jersey's and New Mexico's gages will compete to see whose gage is the greatest for Gage Greatest 2025.

Gage Greatness National Bracket Round One for 2025
2025 Gage Greatness National Bracket Round One

At the USGS, we monitor our nation’s water. Our data informs many people, from kayakers to water managers. Gage Greatness allows any Instagram user to vote for their favorite gage (data collection station).

At the USGS, we monitor our nation’s water. Our data informs many people, from kayakers to water managers. Gage Greatness allows any Instagram user to vote for their favorite gage (data collection station).

Screenshot of video title screen reading How to make a current conditions table using new state pages and my favorites list
WDFN Current Conditions Table How to

Screenshot from Water Data for the Nation video on "How to make a current conditions table using new state pages and My Favorites list"

Screenshot from Water Data for the Nation video on "How to make a current conditions table using new state pages and My Favorites list"

Screenshot of video reading "Water Data for the Nation: How to Show Daily Values on Monitoring Location Pages"
WDFN: How to Show Daily Values on Monitoring Location Pages

Water Data for the Nation: How to Show Daily Values on Monitoring Location Pages video thumbnail

USGS Hydrologic Technician stands on a bridge over flood water measuring the flow with an ADCP held by a rope.
High Flow being measured at Hurricane Creek

USGS hydrologic technician Fred Brogan holds an acoustic doppler current profiler (ADCP) while measuring the highest flow measured to-date on Hurricane Creek at Hurricane, WV. Photo by Logan Jarrell, USGS Hydrologic Technician

USGS hydrologic technician Fred Brogan holds an acoustic doppler current profiler (ADCP) while measuring the highest flow measured to-date on Hurricane Creek at Hurricane, WV. Photo by Logan Jarrell, USGS Hydrologic Technician

NWAA regions map, including aggregated regions
National Water Availability Assessment Hydrologic Regions and Aggregate Regions

Hydrologic regions and aggregated hydrologic regions used in the National Water Availability Assessment report in the conterminous United States, Alaska, Hawaii, Puerto Rico, and the U.S. Virgin Islands. Published in https://doi.org/10.3133/pp1894A

HUC diagram showing the hierarchical, nested way in which HUCs are named
Hydrologic Unit Code (HUC) overview

The U.S. Geological Survey uses a depiction and classification scheme for hydrologic units known as hydrologic unit codes (HUCs). HUCs generally represent catchments, and river basins are represented by a unique series of numbers with successively smaller hydrologic units nested inside of larger ones.

The U.S. Geological Survey uses a depiction and classification scheme for hydrologic units known as hydrologic unit codes (HUCs). HUCs generally represent catchments, and river basins are represented by a unique series of numbers with successively smaller hydrologic units nested inside of larger ones.

Thumbnail for the National Water Availability Assessment Release

Thumbnail image for the Water Resources Mission Area National Water Availability Assessment Release

Illustration of geogenic contaminant mobilization
Geogenic contaminant mobilization illustration

Managed aquifer-recharge methods and processes. Managed recharge—which uses water of dissimilar geochemistry from groundwater through infiltration into shallow aquifers or injection into deep aquifers—can alter hydrologic and geochemical aquifer conditions such that arsenic and other geogenic contaminants are mobilized from sediment to aqueous phase.

Managed aquifer-recharge methods and processes. Managed recharge—which uses water of dissimilar geochemistry from groundwater through infiltration into shallow aquifers or injection into deep aquifers—can alter hydrologic and geochemical aquifer conditions such that arsenic and other geogenic contaminants are mobilized from sediment to aqueous phase.

Graphs showing water-year total precipitation and air temperatures in the Lower Colorado River Basin from 1896 to 2019

Graphs showing water-year total precipitation and air temperatures in the Lower Colorado River Basin from 1896 to 2019, units modified from millimeters to inches of precipitation and from degrees Celsius to degrees Fahrenheit from: Tillman, F.D., Gangopadhyay, S., and Pruitt, T., 2020, Trends in recent historical and projected climate data for the Colorado River Bas

U.S. River Conditions, October to December 2024

U.S. River Conditions, October to December 2024 thumbnail image. The river conditions shown range from the driest condition seen at a gage (red open circles) to the wettest (blue closed circles). A purple outer ring around a gage indicates it is flooding. 

U.S. River Conditions, October to December 2024 thumbnail image. The river conditions shown range from the driest condition seen at a gage (red open circles) to the wettest (blue closed circles). A purple outer ring around a gage indicates it is flooding. 

Map of New York State showing the three pilot study areas for interactive products to assist with geothermal drilling.
Geothermal_Picture1.jpg

Map of New York State showing the three pilot study areas for interactive products to assist with geothermal drilling.

Map of New York State showing the three pilot study areas for interactive products to assist with geothermal drilling.

Two USGS scientists lower a water-quality and sediment sampler into a large river from the side of the boat
Water-quality sampling on the Mississippi River

USGS hydrologic technicians collect water-quality samples on the Mississippi River (USGS monitoring location 322023090544500 Mississippi River Above Vicksburg at Mile 438, MS). 

USGS hydrologic technicians collect water-quality samples on the Mississippi River (USGS monitoring location 322023090544500 Mississippi River Above Vicksburg at Mile 438, MS). 

this community is located over the edwards aquifer recharge zone
Groundwater awareness sign, Edwards Aquifer, Texas
Submerged temperature logger mounted to cobble on riverbed.
Temperature logger in Santiam River basin, Oregon

Temperature logger attached to submerged cobble in Quartzville Creek, OR. This logger was placed as part of an ongoing effort to retrieve continuous temperature data from rivers and tributaries within the Willamette River basin, OR.

Temperature logger attached to submerged cobble in Quartzville Creek, OR. This logger was placed as part of an ongoing effort to retrieve continuous temperature data from rivers and tributaries within the Willamette River basin, OR.

Alton Anderson of the USGS explaining common geophysical tools used to evaluate boreholes to a group of people at a worksite.
Geothermal_Picture3.jpg

Alton Anderson of the USGS explaining common geophysical tools used to evaluate boreholes to a group of people at a worksite.

Alton Anderson of the USGS explaining common geophysical tools used to evaluate boreholes to a group of people at a worksite.

Was this page helpful?