USGS gage 05293000 YELLOW BANK RIVER NEAR ODESSA, MN
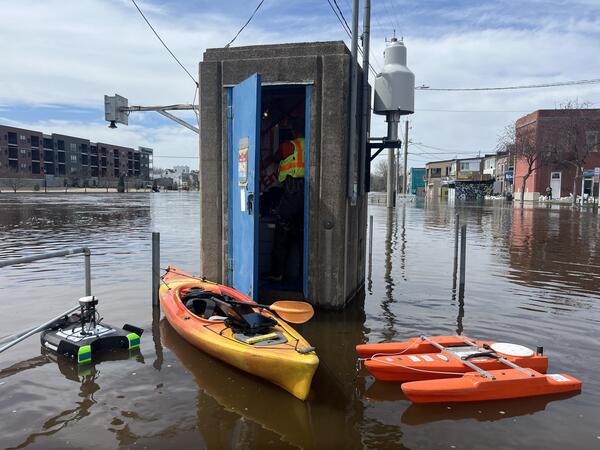
USGS gage 05293000 YELLOW BANK RIVER NEAR ODESSA, MNUSGS gage 05293000 YELLOW BANK RIVER NEAR ODESSA, MN with High River Water Level From Flood.


Official websites use .gov
A .gov website belongs to an official government organization in the United States.

Secure .gov websites use HTTPS
A lock () or https:// means you’ve safely connected to the .gov website. Share sensitive information only on official, secure websites.

The USGS collects real-time flood data and conducts flood science to help keep communities safe before, during, and after a flood.
Floods can occur any time of year, and high-quality flood information is essential for flood forecasting and planning, emergency response, and recovery efforts. The USGS mission to protect life and property is a critical aspect of its role in the nation. By providing reliable scientific information about natural disasters, including flooding, the USGS can help minimize the risk, loss of life, and loss of property from floods. Key activities to this mission are to anticipate, monitor, and respond to hydrologic hazards by providing reliable water data and technical expertise to partner agencies and communities across the Nation. Our flood information provides real-time situational awareness, informs flood predictions, facilitates flood impact response and assessments, supports floodplain and flood inundation mapping, guides infrastructure design and operation, helps map contaminant transport, and more.
The USGS supports these activities through data collection, publication of flood-related publications, analysis of flood exceedance probabilities and magnitudes, and development of methods to estimate floods at unmonitored locations throughout the nation. The USGS develops and deploys observational systems for identifying and tracking flood hazards, providing operational support during extreme hydrologic events, providing data for recovery, and informing community planning and hazard mitigation strategies. These efforts include:
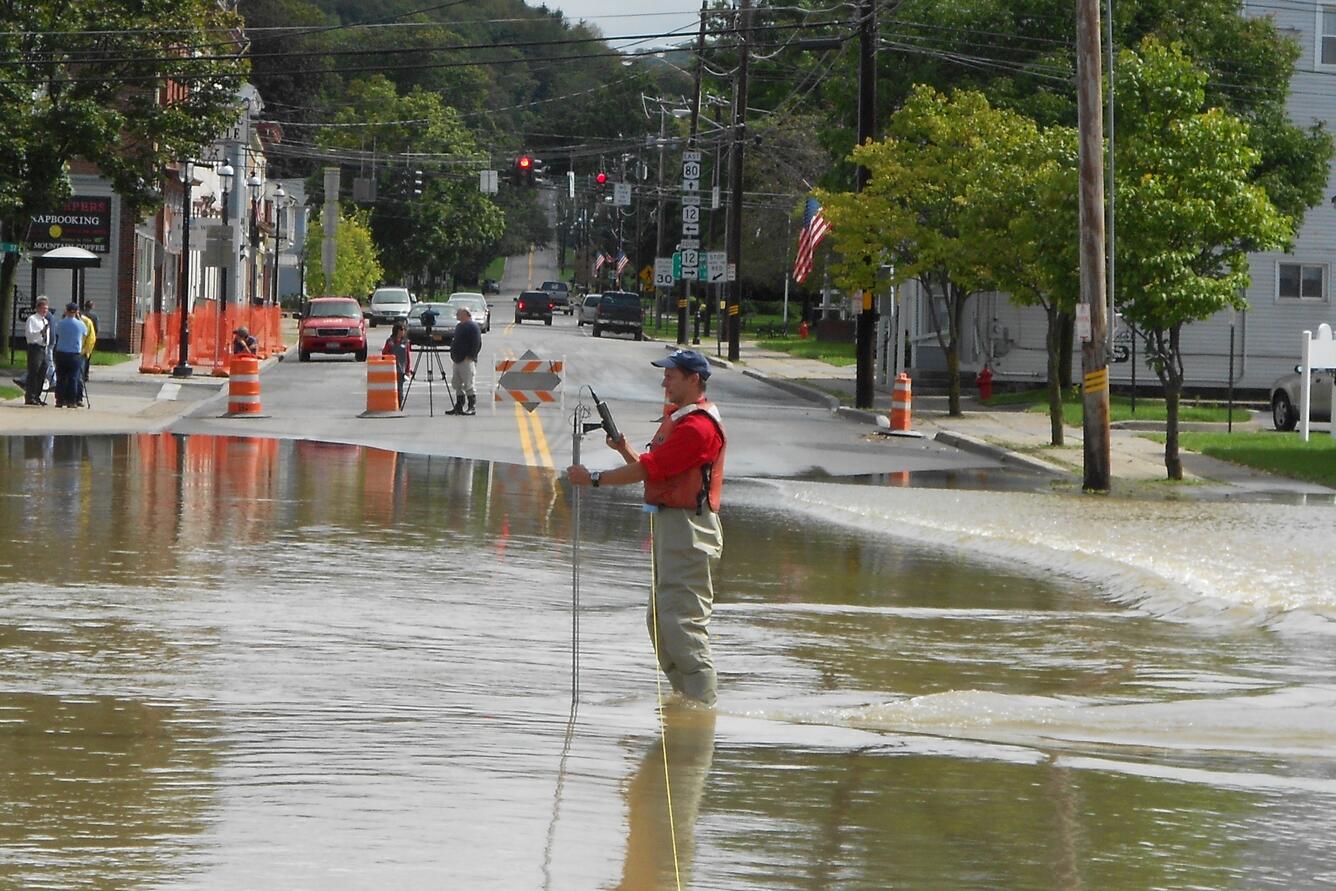
During a flood, the USGS works directly with flood response agencies like the National Weather Service (NWS), Federal Emergency Management Agency (FEMA), U.S. Army Corps of Engineers (USACE), and state and local emergency management agencies to help them access and understand USGS flood data so they can make informed decisions and protect lives and property. USGS maintains two national response coordination teams -- the inland Flood Team and the Coastal Storm Team -- that liaise with our external partners and ensure a unified and effective response to major flood events. The response coordination teams supplement USGS operations and networks to acquire additional priority flood data to meet partner needs.
Learn more about how we study floods, how we measure and map flooding, and how we support flood event response by exploring the links listed on the Science tab.
The USGS offers multiple products to help visualize current flood conditions, estimate flood quantiles, evaluate how large floods measure up historically, and access USGS flood response activities and data, including:




Below are other science projects associated with USGS flood information and activities.


USGS gage 05293000 YELLOW BANK RIVER NEAR ODESSA, MN with High River Water Level From Flood.
USGS gage 05293000 YELLOW BANK RIVER NEAR ODESSA, MN with High River Water Level From Flood.

USGS Storm Tide Sensors are specialized scientific instruments used to measure the depth and duration of storm surge during coastal storms. The data these sensors collect before, during and after a storm will help public officials assess storm damage, and improve computer models used to forecast storm surge and coastal change.
USGS Storm Tide Sensors are specialized scientific instruments used to measure the depth and duration of storm surge during coastal storms. The data these sensors collect before, during and after a storm will help public officials assess storm damage, and improve computer models used to forecast storm surge and coastal change.

Andrew Clark is measuring the overflow section of a major flood at the Little Arkansas River near Sedgwick, Kansas USGS stream gage 07144100.
Andrew Clark is measuring the overflow section of a major flood at the Little Arkansas River near Sedgwick, Kansas USGS stream gage 07144100.

USGS technician Chris Broz helps take water measurements on the Big Sioux River during record flooding in March, 2019.
USGS technician Chris Broz helps take water measurements on the Big Sioux River during record flooding in March, 2019.

After record flooding in the Midwest, USGS crews mobilized to take important water measurements.
After record flooding in the Midwest, USGS crews mobilized to take important water measurements.

A USGS storm-tide sensor, deployed in advance of Hurricane Florence's landfall. The sensors are housed in vented steel pipes a few inches wide and about a foot long. They are being installed on bridges, piers, and other structures that have a good chance of surviving the storm.
A USGS storm-tide sensor, deployed in advance of Hurricane Florence's landfall. The sensors are housed in vented steel pipes a few inches wide and about a foot long. They are being installed on bridges, piers, and other structures that have a good chance of surviving the storm.

Aerial Image of the effects of the 2011 Missouri River Flood
Aerial Image of the effects of the 2011 Missouri River Flood

Peak-flow measurement at Flathead River at Flathead, British Columbia
Peak-flow measurement at Flathead River at Flathead, British Columbia

Flooding in Soldier Pond, Maine, following rainfall and snowmelt that led to high water levels in the Fish and St. John Rivers in April and May of 2018.
Flooding in Soldier Pond, Maine, following rainfall and snowmelt that led to high water levels in the Fish and St. John Rivers in April and May of 2018.

USGS field crews installed a temporary rapid deployment gage on May 2, 2018, at Soldier Pond in the Fish River to monitor flooding near Fort Kent in Maine.
USGS field crews installed a temporary rapid deployment gage on May 2, 2018, at Soldier Pond in the Fish River to monitor flooding near Fort Kent in Maine.

Jim Duda, USGS hydrologic technician, installs a Rapid-Deployment Gauge near the Elizabeth River in Norfolk, Virginia, to monitor elevated water levels caused by Hurricane Jose. An RDG is a fully functional streamgage designed to be quickly deployed for real-time data monitoring of a stream or river in emergency situations.
Jim Duda, USGS hydrologic technician, installs a Rapid-Deployment Gauge near the Elizabeth River in Norfolk, Virginia, to monitor elevated water levels caused by Hurricane Jose. An RDG is a fully functional streamgage designed to be quickly deployed for real-time data monitoring of a stream or river in emergency situations.

USGS scientist Alec MacDonald takes flood measurements on the Guadalupe River in Victoria, Texas.
USGS scientist Alec MacDonald takes flood measurements on the Guadalupe River in Victoria, Texas.

USGS scientist Darwin Ockerman installs a storm-tide sensor at Packery Channel near Corpus Christi, Texas.
USGS scientist Darwin Ockerman installs a storm-tide sensor at Packery Channel near Corpus Christi, Texas.

USGS employee measuring road overflow during a record flood event at Little Wapsipinicon River near Oran, IA USGS gage ID 5420850
USGS employee measuring road overflow during a record flood event at Little Wapsipinicon River near Oran, IA USGS gage ID 5420850

USGS employee Aaron Walsh performing wire weight measurement in record flood at gage 7018500 Big River at Byrnesville, MO
USGS employee Aaron Walsh performing wire weight measurement in record flood at gage 7018500 Big River at Byrnesville, MO

Hurricane Sandy struck the New Jersey shore October 29–31, 2012. Houses, cars, and a street in Seaside Heights, New Jersey, were covered in beach sand after the hurricane's storm tide receded
Hurricane Sandy struck the New Jersey shore October 29–31, 2012. Houses, cars, and a street in Seaside Heights, New Jersey, were covered in beach sand after the hurricane's storm tide receded

Storm surge sensor installation prior to Hurricane Irene landfall
Storm surge sensor installation prior to Hurricane Irene landfall

Devastating floods across much of the U.S. were severe and unrelenting during the spring and summer of 2011. When floods happen, USGS crews are among the first-responders.
Devastating floods across much of the U.S. were severe and unrelenting during the spring and summer of 2011. When floods happen, USGS crews are among the first-responders.

USGS hydrographer Jerrod Wheeler (in cablecar) measures flood flows right before the gagehouse washes away.
06225500 Wind River near Crowheart, WY: Jul 01 2011; 13,900 ft3/s
USGS hydrographer Jerrod Wheeler (in cablecar) measures flood flows right before the gagehouse washes away.
06225500 Wind River near Crowheart, WY: Jul 01 2011; 13,900 ft3/s

Souris River in Minot, North Dakota flooded many buildings and homes in the Odds Mobile Home Park.
Photo taken by USGS personnel during a FEMA Flood Inundation Mapping Project.
Souris River in Minot, North Dakota flooded many buildings and homes in the Odds Mobile Home Park.
Photo taken by USGS personnel during a FEMA Flood Inundation Mapping Project.

The Souris River downstream of the Sherwood, ND gage.
Photo taken by USGS personnel on a Civil Air Patrol flight.
The Souris River downstream of the Sherwood, ND gage.
Photo taken by USGS personnel on a Civil Air Patrol flight.
The USGS collects real-time flood data and conducts flood science to help keep communities safe before, during, and after a flood.
Floods can occur any time of year, and high-quality flood information is essential for flood forecasting and planning, emergency response, and recovery efforts. The USGS mission to protect life and property is a critical aspect of its role in the nation. By providing reliable scientific information about natural disasters, including flooding, the USGS can help minimize the risk, loss of life, and loss of property from floods. Key activities to this mission are to anticipate, monitor, and respond to hydrologic hazards by providing reliable water data and technical expertise to partner agencies and communities across the Nation. Our flood information provides real-time situational awareness, informs flood predictions, facilitates flood impact response and assessments, supports floodplain and flood inundation mapping, guides infrastructure design and operation, helps map contaminant transport, and more.
The USGS supports these activities through data collection, publication of flood-related publications, analysis of flood exceedance probabilities and magnitudes, and development of methods to estimate floods at unmonitored locations throughout the nation. The USGS develops and deploys observational systems for identifying and tracking flood hazards, providing operational support during extreme hydrologic events, providing data for recovery, and informing community planning and hazard mitigation strategies. These efforts include:
During a flood, the USGS works directly with flood response agencies like the National Weather Service (NWS), Federal Emergency Management Agency (FEMA), U.S. Army Corps of Engineers (USACE), and state and local emergency management agencies to help them access and understand USGS flood data so they can make informed decisions and protect lives and property. USGS maintains two national response coordination teams -- the inland Flood Team and the Coastal Storm Team -- that liaise with our external partners and ensure a unified and effective response to major flood events. The response coordination teams supplement USGS operations and networks to acquire additional priority flood data to meet partner needs.
Learn more about how we study floods, how we measure and map flooding, and how we support flood event response by exploring the links listed on the Science tab.
The USGS offers multiple products to help visualize current flood conditions, estimate flood quantiles, evaluate how large floods measure up historically, and access USGS flood response activities and data, including:
Below are other science projects associated with USGS flood information and activities.
USGS gage 05293000 YELLOW BANK RIVER NEAR ODESSA, MN with High River Water Level From Flood.
USGS gage 05293000 YELLOW BANK RIVER NEAR ODESSA, MN with High River Water Level From Flood.
USGS Storm Tide Sensors are specialized scientific instruments used to measure the depth and duration of storm surge during coastal storms. The data these sensors collect before, during and after a storm will help public officials assess storm damage, and improve computer models used to forecast storm surge and coastal change.
USGS Storm Tide Sensors are specialized scientific instruments used to measure the depth and duration of storm surge during coastal storms. The data these sensors collect before, during and after a storm will help public officials assess storm damage, and improve computer models used to forecast storm surge and coastal change.
Andrew Clark is measuring the overflow section of a major flood at the Little Arkansas River near Sedgwick, Kansas USGS stream gage 07144100.
Andrew Clark is measuring the overflow section of a major flood at the Little Arkansas River near Sedgwick, Kansas USGS stream gage 07144100.
USGS technician Chris Broz helps take water measurements on the Big Sioux River during record flooding in March, 2019.
USGS technician Chris Broz helps take water measurements on the Big Sioux River during record flooding in March, 2019.
After record flooding in the Midwest, USGS crews mobilized to take important water measurements.
After record flooding in the Midwest, USGS crews mobilized to take important water measurements.
A USGS storm-tide sensor, deployed in advance of Hurricane Florence's landfall. The sensors are housed in vented steel pipes a few inches wide and about a foot long. They are being installed on bridges, piers, and other structures that have a good chance of surviving the storm.
A USGS storm-tide sensor, deployed in advance of Hurricane Florence's landfall. The sensors are housed in vented steel pipes a few inches wide and about a foot long. They are being installed on bridges, piers, and other structures that have a good chance of surviving the storm.
Aerial Image of the effects of the 2011 Missouri River Flood
Aerial Image of the effects of the 2011 Missouri River Flood
Peak-flow measurement at Flathead River at Flathead, British Columbia
Peak-flow measurement at Flathead River at Flathead, British Columbia
Flooding in Soldier Pond, Maine, following rainfall and snowmelt that led to high water levels in the Fish and St. John Rivers in April and May of 2018.
Flooding in Soldier Pond, Maine, following rainfall and snowmelt that led to high water levels in the Fish and St. John Rivers in April and May of 2018.
USGS field crews installed a temporary rapid deployment gage on May 2, 2018, at Soldier Pond in the Fish River to monitor flooding near Fort Kent in Maine.
USGS field crews installed a temporary rapid deployment gage on May 2, 2018, at Soldier Pond in the Fish River to monitor flooding near Fort Kent in Maine.
Jim Duda, USGS hydrologic technician, installs a Rapid-Deployment Gauge near the Elizabeth River in Norfolk, Virginia, to monitor elevated water levels caused by Hurricane Jose. An RDG is a fully functional streamgage designed to be quickly deployed for real-time data monitoring of a stream or river in emergency situations.
Jim Duda, USGS hydrologic technician, installs a Rapid-Deployment Gauge near the Elizabeth River in Norfolk, Virginia, to monitor elevated water levels caused by Hurricane Jose. An RDG is a fully functional streamgage designed to be quickly deployed for real-time data monitoring of a stream or river in emergency situations.
USGS scientist Alec MacDonald takes flood measurements on the Guadalupe River in Victoria, Texas.
USGS scientist Alec MacDonald takes flood measurements on the Guadalupe River in Victoria, Texas.
USGS scientist Darwin Ockerman installs a storm-tide sensor at Packery Channel near Corpus Christi, Texas.
USGS scientist Darwin Ockerman installs a storm-tide sensor at Packery Channel near Corpus Christi, Texas.
USGS employee measuring road overflow during a record flood event at Little Wapsipinicon River near Oran, IA USGS gage ID 5420850
USGS employee measuring road overflow during a record flood event at Little Wapsipinicon River near Oran, IA USGS gage ID 5420850
USGS employee Aaron Walsh performing wire weight measurement in record flood at gage 7018500 Big River at Byrnesville, MO
USGS employee Aaron Walsh performing wire weight measurement in record flood at gage 7018500 Big River at Byrnesville, MO
Hurricane Sandy struck the New Jersey shore October 29–31, 2012. Houses, cars, and a street in Seaside Heights, New Jersey, were covered in beach sand after the hurricane's storm tide receded
Hurricane Sandy struck the New Jersey shore October 29–31, 2012. Houses, cars, and a street in Seaside Heights, New Jersey, were covered in beach sand after the hurricane's storm tide receded
Storm surge sensor installation prior to Hurricane Irene landfall
Storm surge sensor installation prior to Hurricane Irene landfall
Devastating floods across much of the U.S. were severe and unrelenting during the spring and summer of 2011. When floods happen, USGS crews are among the first-responders.
Devastating floods across much of the U.S. were severe and unrelenting during the spring and summer of 2011. When floods happen, USGS crews are among the first-responders.
USGS hydrographer Jerrod Wheeler (in cablecar) measures flood flows right before the gagehouse washes away.
06225500 Wind River near Crowheart, WY: Jul 01 2011; 13,900 ft3/s
USGS hydrographer Jerrod Wheeler (in cablecar) measures flood flows right before the gagehouse washes away.
06225500 Wind River near Crowheart, WY: Jul 01 2011; 13,900 ft3/s
Souris River in Minot, North Dakota flooded many buildings and homes in the Odds Mobile Home Park.
Photo taken by USGS personnel during a FEMA Flood Inundation Mapping Project.
Souris River in Minot, North Dakota flooded many buildings and homes in the Odds Mobile Home Park.
Photo taken by USGS personnel during a FEMA Flood Inundation Mapping Project.
The Souris River downstream of the Sherwood, ND gage.
Photo taken by USGS personnel on a Civil Air Patrol flight.
The Souris River downstream of the Sherwood, ND gage.
Photo taken by USGS personnel on a Civil Air Patrol flight.