
Data and Knowledge Gaps of a Water Bottling Facility Inventory and Select Water-Use Dataset
Water bottling across the U.S.
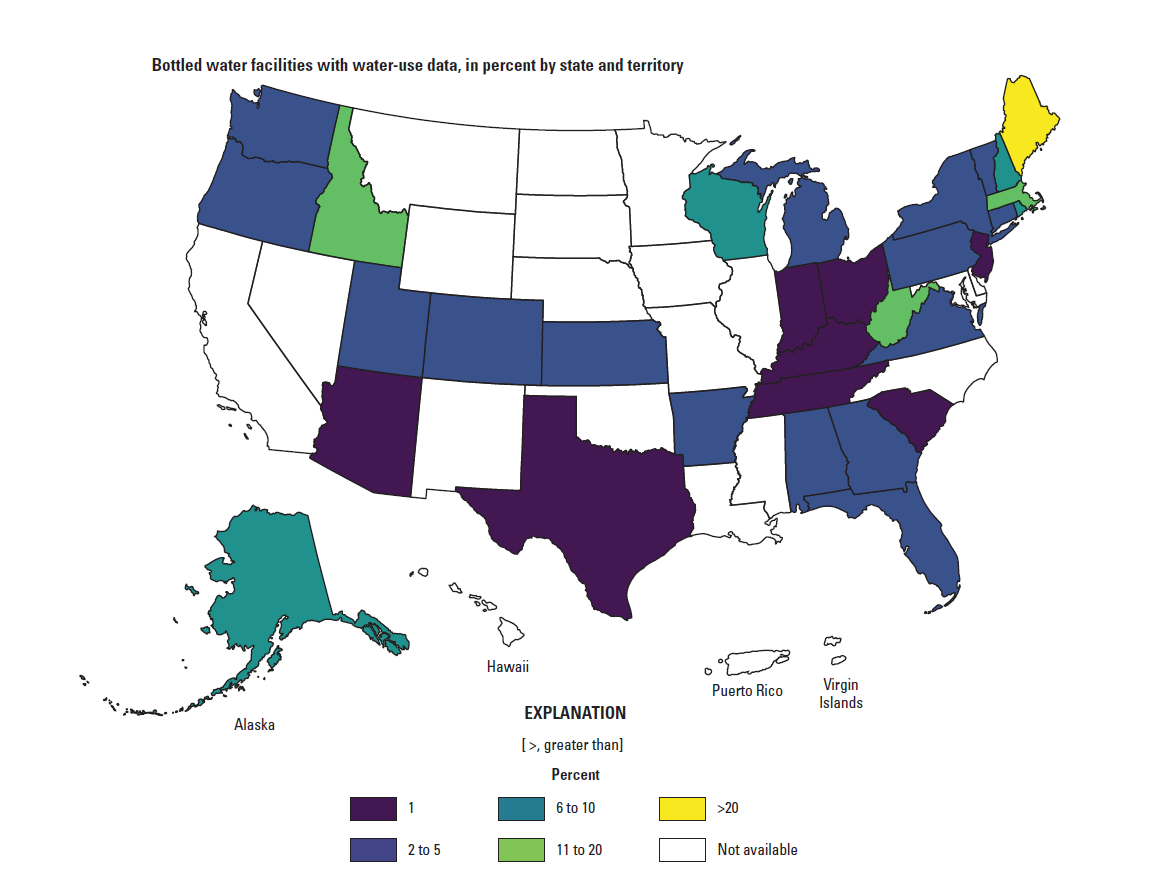
Inventory of Water Bottling Facilities
USGS is compiling data on locations and volumes of water withdrawals for bottled water production and learning how, when, and where bottled water withdrawals result in changes to groundwater levels, spring flows, and water quality.
Background

Bottled water is widely used for convenience and personal preference and is important during water supply emergencies when normal drinking water sources are disrupted. Bottled water is sourced from public supply systems, or from privately owned intakes from streams, lakes, springs, or groundwater wells.
The U.S. Food and Drug Administration regulates the quality of bottled drinking water, however, the water withdrawals for bottling from natural water resources are not federally regulated. Thus, there is little information at the national scale about source locations and water withdrawals for bottled water.
Study Plans
USGS is assessing water withdrawals for bottling in relation to water availability – water quality, groundwater levels, and other factors. The research aims to develop tools that can be used to estimate potential changes in the future as withdrawals, climate, and socioeconomic conditions change.
Project components include:
- National inventory of bottling facilities, facility characteristics, and water withdrawals
- Assessment of the completeness, uniqueness, validity, timeliness, accuracy, consistency, and accessibility of the national inventory, and the resulting implications of the data and knowledge gaps for users of the data
- Regional assessments of withdrawals for water bottling and changes to local groundwater levels, spring flow, water quality, and other conditions
- East Twin/Strawberry Creek watersheds – California
- Great Lakes watershed – Illinois, Indiana, Michigan, Minnesota, Ohio, Pennsylvania, New York, Vermont, Wisconsin
- Saco River basin – Maine, New Hampshire
- Sante Fe River basin – Florida
- National Synthesis
- Identify relationships between socioeconomic conditions, water availability, ecosystems, and locations of bottling facilities
Research Products
Water bottling across the U.S. - Interactive map & data visualization
Inventory of water bottling facilities in the United States, 2024, and select water-use data, 1955-2023 (ver. 2.0, November 2024) - Data Release


Collaborative Science Provides Understanding of Contaminants in Bottled Water-an Increasingly Common Alternate Drinking Water Source

Drinking Water and Source Water Research

Where can I find information about bottled water? Where can I find information about bottled water?
Bottled water is regulated by the U.S. Food and Drug Administration and by individual states. For general information about bottled water, sources include the International Bottled Water Association and NSF International. Learn More: Water bottling across the U.S. - interactive map Water Use - Withdrawals for Bottled Water

How much water is used by people in the United States? How much water is used by people in the United States?
Since 1950, the USGS has collected and analyzed water-use data for the United States and its Territories. That data is revised every 5 years. As of 2015, the United States uses 322 billion gallons of water per day (Bgal/day). The three largest water-use categories were irrigation (118 Bgal/day), thermoelectric power (133 Bgal/day), and public supply (39 Bgal/day), cumulatively accounting for 90...
USGS is compiling data on locations and volumes of water withdrawals for bottled water production and learning how, when, and where bottled water withdrawals result in changes to groundwater levels, spring flows, and water quality.
Background
Bottled water is widely used for convenience and personal preference and is important during water supply emergencies when normal drinking water sources are disrupted. Bottled water is sourced from public supply systems, or from privately owned intakes from streams, lakes, springs, or groundwater wells.
The U.S. Food and Drug Administration regulates the quality of bottled drinking water, however, the water withdrawals for bottling from natural water resources are not federally regulated. Thus, there is little information at the national scale about source locations and water withdrawals for bottled water.
Study Plans
USGS is assessing water withdrawals for bottling in relation to water availability – water quality, groundwater levels, and other factors. The research aims to develop tools that can be used to estimate potential changes in the future as withdrawals, climate, and socioeconomic conditions change.
Project components include:
- National inventory of bottling facilities, facility characteristics, and water withdrawals
- Assessment of the completeness, uniqueness, validity, timeliness, accuracy, consistency, and accessibility of the national inventory, and the resulting implications of the data and knowledge gaps for users of the data
- Regional assessments of withdrawals for water bottling and changes to local groundwater levels, spring flow, water quality, and other conditions
- East Twin/Strawberry Creek watersheds – California
- Great Lakes watershed – Illinois, Indiana, Michigan, Minnesota, Ohio, Pennsylvania, New York, Vermont, Wisconsin
- Saco River basin – Maine, New Hampshire
- Sante Fe River basin – Florida
- National Synthesis
- Identify relationships between socioeconomic conditions, water availability, ecosystems, and locations of bottling facilities
Research Products
Water bottling across the U.S. - Interactive map & data visualization
Inventory of water bottling facilities in the United States, 2024, and select water-use data, 1955-2023 (ver. 2.0, November 2024) - Data Release
Collaborative Science Provides Understanding of Contaminants in Bottled Water-an Increasingly Common Alternate Drinking Water Source
Drinking Water and Source Water Research
Where can I find information about bottled water? Where can I find information about bottled water?
Bottled water is regulated by the U.S. Food and Drug Administration and by individual states. For general information about bottled water, sources include the International Bottled Water Association and NSF International. Learn More: Water bottling across the U.S. - interactive map Water Use - Withdrawals for Bottled Water
How much water is used by people in the United States? How much water is used by people in the United States?
Since 1950, the USGS has collected and analyzed water-use data for the United States and its Territories. That data is revised every 5 years. As of 2015, the United States uses 322 billion gallons of water per day (Bgal/day). The three largest water-use categories were irrigation (118 Bgal/day), thermoelectric power (133 Bgal/day), and public supply (39 Bgal/day), cumulatively accounting for 90...