
The 100 millionth Landsat scene downloaded from the Landsat data archive at the USGS Earth Resources Observation and Science (EROS) Center in Sioux Falls, South Dakota. The Landsat 8 scene was acquired on May 24, 2017 of WRS-2 Path 73, Row 87.
Images
Explore our planet through photography and imagery, including climate change and water all the way back to the 1800s when the USGS was surveying the country by horse and buggy.
Filter Total Items: 21345

100 Millionth Landsat download with labels
The 100 millionth Landsat scene downloaded from the Landsat data archive at the USGS Earth Resources Observation and Science (EROS) Center in Sioux Falls, South Dakota. The Landsat 8 scene was acquired on May 24, 2017 of WRS-2 Path 73, Row 87.

Deploying seismic gear
USGS staff are preparing to deploy the Edgetech 512i sub-bottom profiling system from the stern of a research vessel. The sub-bottom profiling system was used to map the geologic structure and sediments beneath the seafloor.
USGS staff are preparing to deploy the Edgetech 512i sub-bottom profiling system from the stern of a research vessel. The sub-bottom profiling system was used to map the geologic structure and sediments beneath the seafloor.

Seismic system deployed from research vessel
Image of the chirp 512i sub-bottom profiling system towed behind a research vessel during a seafloor mapping research effort. USGS staff, Alex Nichols, is in the foreground of the image.
Image of the chirp 512i sub-bottom profiling system towed behind a research vessel during a seafloor mapping research effort. USGS staff, Alex Nichols, is in the foreground of the image.

Cooperators learn about Otowi Streamgage in New Mexico
Cooperators learn about Otowi Streamgage in New MexicoMany eyes watch the amount of water running past the important Otowi streamflow gage. On May 23rd, Tyson Hatch from the New Mexico Water Science Center (NMWSC) presented an overview of the streamgaging activities of the Otowi Gage to participants of the Rio Chama Basin and San Juan-Chama Project Tour.

Indian Paintbrush in front of the Rio Chama in New Mexico
Indian Paintbrush in front of the Rio Chama in New MexicoThis photo was taken during a routine site visit to measure streamflow on the Rio Chama in New Mexico.
Indian Paintbrush in front of the Rio Chama in New Mexico
Indian Paintbrush in front of the Rio Chama in New MexicoThis photo was taken during a routine site visit to measure streamflow on the Rio Chama in New Mexico.

Geophysicist collects gravity reading near Gibbon Falls Yellowstone
Geophysicist collects gravity reading near Gibbon Falls YellowstoneGeophysicist Elske de Zeeuw-van Dalfsen (Royal Netherlands Meteorological Institute) collects a gravity reading from a station near Gibbon Falls in Yellowstone National Park. Gravity data collection was completed under Yellowstone National Park research permit 7074.
CDI Workshop 2017
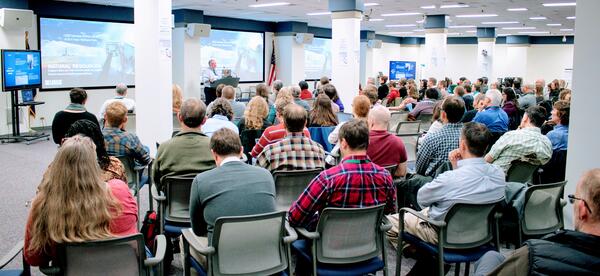
Bill Werkheiser gives a keynote address at the CDI 2017 Workshop. More information at https://my.usgs.gov/confluence/x/tofHI .
Bill Werkheiser gives a keynote address at the CDI 2017 Workshop. More information at https://my.usgs.gov/confluence/x/tofHI .

Collecting water-quality sample by wading in the Maumee River, Ohio
Collecting water-quality sample by wading in the Maumee River, OhioStephanie Kula is collecting water-quality sample by wading in the Maumee River near Defiance, Ohio, for the Western Lake Erie Basin project. Nutrients (nitrogen and phosphorus) and sediment from urban and agricultural practices are a concern in the Western Lake Erie Basin watersheds in northwester

Santa Cruz Main Beach
Still-image from video camera atop the Dream Inn looks eastward over Main Beach and boardwalk in Santa Cruz, CA.
Still-image from video camera atop the Dream Inn looks eastward over Main Beach and boardwalk in Santa Cruz, CA.

Scientist measuring the length of the forearm of a bat
Scientist measuring the length of the forearm of a batHere a scientist is measuring the length of the forearm of a bat captured in Dane County, Wisconsin. General morphometric data are collected from each bat captured.
Scientist measuring the length of the forearm of a bat
Scientist measuring the length of the forearm of a batHere a scientist is measuring the length of the forearm of a bat captured in Dane County, Wisconsin. General morphometric data are collected from each bat captured.

field engineers upgrade a tiltmeter on Kīlauea
USGS Hawaiian Volcano Observatory field engineers upgrade a tiltmeter on Kīlauea Volcano's East Rift Zone. The upgrade consisted of switching the old analog instrument to a newer digital model. This tiltmeter is used to track magma movement within the volcano.
USGS Hawaiian Volcano Observatory field engineers upgrade a tiltmeter on Kīlauea Volcano's East Rift Zone. The upgrade consisted of switching the old analog instrument to a newer digital model. This tiltmeter is used to track magma movement within the volcano.

Okefenokee Fire Continues to Burn
A wildfire ignited by lightning in the Okefenokee National Wildlife Refuge on April 6, 2017, is persisting into May. Hot, dry weather and extremely dry fuels are making the fire difficult to contain. As of May 22, the blaze, also called the West Mims Fire, had burned 152,478 acres.
A wildfire ignited by lightning in the Okefenokee National Wildlife Refuge on April 6, 2017, is persisting into May. Hot, dry weather and extremely dry fuels are making the fire difficult to contain. As of May 22, the blaze, also called the West Mims Fire, had burned 152,478 acres.

An ecologist uses a net to collect a sample of aquatic invertebrates
An ecologist uses a net to collect a sample of aquatic invertebratesAs part of the Regional Stream Quality Assessments (RSQA), hydrologists, ecologists, and technicians did ecological surveys of aquatic biota and stream habitat. Here, an ecologist uses a net to collect a sample of aquatic invertebrates for ennumeration and identification.

Measuring stream stage on Muddy Creek near Dad
Measuring stream stage on Muddy Creek near Dad

Urban outfall to Sausal Creek
Graffiti adorns an outfall pipe discharging stormwater into Sausal Creek. Sausal Creek was one of the many urban creeks sampled by the Regional Stream Quality Assessment (RSQA).
Graffiti adorns an outfall pipe discharging stormwater into Sausal Creek. Sausal Creek was one of the many urban creeks sampled by the Regional Stream Quality Assessment (RSQA).

Biofilms colonize a deployed tile
Biofilms take up pesticides in streams. Here, a hydrologic technician collects a sample of biofilm that has colonized an unglazed ceramic tile over 60-90 days. Learn more about biofilms as integrative samplers of pesticides here.
Biofilms take up pesticides in streams. Here, a hydrologic technician collects a sample of biofilm that has colonized an unglazed ceramic tile over 60-90 days. Learn more about biofilms as integrative samplers of pesticides here.

Biofilms colonize a deployed tile
Biofilms take up pesticides in streams. Here, a hydrologic technician hold ups an unglazed ceramic tile that has been colonized by biofilm over 60-90 days. Learn more about biofilms as integrative samplers of pesticides here.
Biofilms take up pesticides in streams. Here, a hydrologic technician hold ups an unglazed ceramic tile that has been colonized by biofilm over 60-90 days. Learn more about biofilms as integrative samplers of pesticides here.

Hydrologic technicians survey and record streambed characteristics
Hydrologic technicians survey and record streambed characteristicsAs part of the Regional Stream Quality Assessments (RSQA), hydrologists, ecologists, and technicians did ecological surveys of aquatic biota and stream habitat. Here, two hydrologic technicians record characteristics of stream habitat.
“Pixel instruments” on photo of beach in Santa Cruz, California
“Pixel instruments” on photo of beach in Santa Cruz, CaliforniaFrame from video of Cowells Beach in Santa Cruz, California, showing “pixel instruments” measured continuously during the video and used to estimate different coastal processes. The blue dots represent an array of pixels used by a computer program called cBathy to estimate seafloor depths (bathymetry).

A hydrologic technician records stream habitat characteristics
A hydrologic technician records stream habitat characteristicsAs part of the Regional Stream Quality Assessments (RSQA), hydrologists, ecologists, and technicians did ecological surveys of aquatic biota and stream habitat. Here, a hydrologic technician records characteristics of the habitat of a highly urbanized stream.