
Heavy rains in late December 2016 and early January 2017 are affecting soybean production in Argentina's bread-basket provinces while impacting soy prices worldwide.
Images
Total: 0
Advanced Search
Choose search keyword and/or remove with "X" in search keyword button below.
Filters
Total: 0
Total: 0
Advanced Search
Choose search keyword and/or remove with "X" in search keyword button below.
Filters
Settings
Total: 0
Explore our planet through photography and imagery, including climate change and water all the way back to the 1800s when the USGS was surveying the country by horse and buggy.
Filter Total Items: 21609

Satellite image showing flooding in Argentina
Heavy rains in late December 2016 and early January 2017 are affecting soybean production in Argentina's bread-basket provinces while impacting soy prices worldwide.

This video clip of Kīlauea's summit lava lake shows spattering alon...
This video clip of Kīlauea Volcano's summit lava lake shows spattering along the southeast margin of the lake.
This video clip of Kīlauea Volcano's summit lava lake shows spattering along the southeast margin of the lake.

Ice-affected stream discharge measurement.
Hydrologic Technician, James Albrecht, from the North Platte Field Office making a measurement of discharge under ice using a Flowtracker acoustic velocity meter on a top-setting wading rod. The string going across the picture is a tagline, used for measuring distance across the channel so that he can note the location of the ice hole he is working in. T
Hydrologic Technician, James Albrecht, from the North Platte Field Office making a measurement of discharge under ice using a Flowtracker acoustic velocity meter on a top-setting wading rod. The string going across the picture is a tagline, used for measuring distance across the channel so that he can note the location of the ice hole he is working in. T

Net Sedimentation Tile (NST)
A net sedimentation tile (NST) is used by scientists to measure surface sediment deposition in wetlands over short time scales. Scientists installed several NSTs on the surface of the marsh to measure sediment deposition. The samples are retrieved and measured in the lab to identify short-term sediment deposition rates on the marsh surface.
A net sedimentation tile (NST) is used by scientists to measure surface sediment deposition in wetlands over short time scales. Scientists installed several NSTs on the surface of the marsh to measure sediment deposition. The samples are retrieved and measured in the lab to identify short-term sediment deposition rates on the marsh surface.

Spattering along a down-welling section of Kīlauea Volcano's summit
This telephoto image from January 19, 2017, shows spattering along a down-welling section of Kīlauea Volcano's summit lava lake. The main area of spattering was about 10 m (32 ft) high, but some lava fragments were thrown even higher.
This telephoto image from January 19, 2017, shows spattering along a down-welling section of Kīlauea Volcano's summit lava lake. The main area of spattering was about 10 m (32 ft) high, but some lava fragments were thrown even higher.

The Molecular Ecology Lab at the Fort Collins Science Center
The Molecular Ecology Lab at the Fort Collins Science Center
The Molecular Ecology Lab at the Fort Collins Science Center
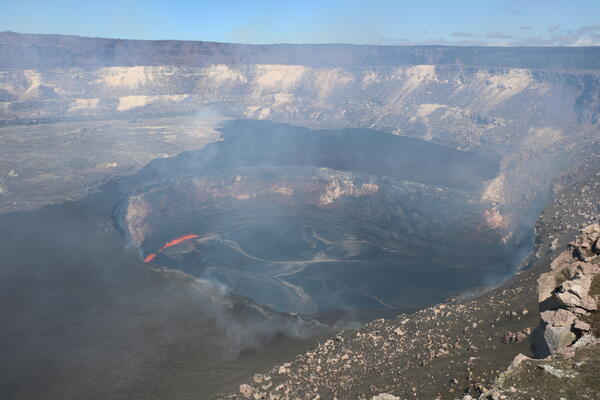
Lower level of Kīlauea's summit lava lake exposes vent wall
The summit lava lake within Halema‘uma‘u Crater today (Jan. 15, 2017) was about 50.5 m (166 ft) below the crater floor (vent rim). One of the most interesting things exposed by the lower lake level was the clear view of the thick, dark veneer of lava on the eastern vent wall (close-up shown below).
The summit lava lake within Halema‘uma‘u Crater today (Jan. 15, 2017) was about 50.5 m (166 ft) below the crater floor (vent rim). One of the most interesting things exposed by the lower lake level was the clear view of the thick, dark veneer of lava on the eastern vent wall (close-up shown below).

Mount Adams viewed from the south-SE.
Mount Adams viewed from the south-southeast.
Mount Adams viewed from the south-southeast.

Invasive Aquatic Vegetation, Sacramento-San Joaquin Delta
Invasive aquatic vegetation chokes Lindsey Slough, creating a potentially challenging environment for fish and other aquatic life. The slough is the site of a 2014 restoration project in the Sacramento-San Joaquin Delta to improve freshwater tidal marsh and spawning habitat for Delta smelt and other fish.
Invasive aquatic vegetation chokes Lindsey Slough, creating a potentially challenging environment for fish and other aquatic life. The slough is the site of a 2014 restoration project in the Sacramento-San Joaquin Delta to improve freshwater tidal marsh and spawning habitat for Delta smelt and other fish.

Invasive Brazilian Waterweed, Sacramento-San Joaquin Delta
Landscape ecologist Shruti Khanna uses a threshing rake to collect Brazilian waterweed (Egeria densa) in the Delta. The USGS is conducting research to measure the impact of invasive aquatic vegetation on sediment transport, turbidity, and marsh accretion rates in Delta.
Landscape ecologist Shruti Khanna uses a threshing rake to collect Brazilian waterweed (Egeria densa) in the Delta. The USGS is conducting research to measure the impact of invasive aquatic vegetation on sediment transport, turbidity, and marsh accretion rates in Delta.

Invasive water primrose
Invasive water primrose (Ludwigia species) and water hyacinth (Eichhornia crassipes) line the marsh edge in Mandeville Cut near the Port of Stockton, California’s third largest port. Invasive aquatic vegetation – dominated by Brazilian waterweed, water hyacinth, and water primrose – has increased exponentially in recent years, cloggi
Invasive water primrose (Ludwigia species) and water hyacinth (Eichhornia crassipes) line the marsh edge in Mandeville Cut near the Port of Stockton, California’s third largest port. Invasive aquatic vegetation – dominated by Brazilian waterweed, water hyacinth, and water primrose – has increased exponentially in recent years, cloggi

Clearing snow from solar panels
Clearing snow from solar panels which provide power to an instream Passive Integrated Transponder tag detection system in the Wind River, WA. The system detects tagged juvenile and adult Steelhead for population assessment and migratory data.
Clearing snow from solar panels which provide power to an instream Passive Integrated Transponder tag detection system in the Wind River, WA. The system detects tagged juvenile and adult Steelhead for population assessment and migratory data.

USGS researcher uses GPS-equipped backpack to measure sand elevations
USGS oceanographer Dan Hoover uses a GPS-equipped backpack to measure sand elevations near the mouth of the San Lorenzo River in Santa Cruz, California, January 12, 2017. Surveys like this make long-term studies of coastal change possible.
USGS oceanographer Dan Hoover uses a GPS-equipped backpack to measure sand elevations near the mouth of the San Lorenzo River in Santa Cruz, California, January 12, 2017. Surveys like this make long-term studies of coastal change possible.

Annotated photo of Bogoslof Island showing effects of eruption
Annotated photograph of Bogoslof Island showing the cumulative effects of 2016-17 eruptive activity. A layer of fine muddy appearing ash drapes most of the landscape and covers pre-existing vegetation. The dashed line indicates the area excavated by explosive eruptive activity so far.
Annotated photograph of Bogoslof Island showing the cumulative effects of 2016-17 eruptive activity. A layer of fine muddy appearing ash drapes most of the landscape and covers pre-existing vegetation. The dashed line indicates the area excavated by explosive eruptive activity so far.

Acoustic Doppler Current Profiler
A U.S. Geological Survey field crew uses an Acoustic Doppler Current Profiler to measure water velocity on the Truckee River in Reno, Nevada.
A U.S. Geological Survey field crew uses an Acoustic Doppler Current Profiler to measure water velocity on the Truckee River in Reno, Nevada.

Atmospheric River Fills California Rivers with Water and Sediment
An atmospheric river, or narrow band of moisture moving from the tropics to the higher latitudes, hit California in early January and brought the first heavy rains of 2017. While these storms help a drought-stricken state, the onslaught of rain triggers floods and mudslides, and fills rising rivers with sediment and debris.
An atmospheric river, or narrow band of moisture moving from the tropics to the higher latitudes, hit California in early January and brought the first heavy rains of 2017. While these storms help a drought-stricken state, the onslaught of rain triggers floods and mudslides, and fills rising rivers with sediment and debris.

LA_Chenier Plain QL2 Lidar
High-resolution lidar task in coastal Louisiana in partnership with the Louisiana Coastal Protection and Restoration Authority (CPRA) to support a current elevation dataset in a rapidly changing coastal deltaic environment.
High-resolution lidar task in coastal Louisiana in partnership with the Louisiana Coastal Protection and Restoration Authority (CPRA) to support a current elevation dataset in a rapidly changing coastal deltaic environment.

Wildfires Scorch Pampas Region of Argentina
Since mid-December 2016, roughly two dozen wildfires in the Pampas region of Argentina have consumed almost 2.5 million acres while unleashing giant plumes of dense smoke above the rural landscapes.
Since mid-December 2016, roughly two dozen wildfires in the Pampas region of Argentina have consumed almost 2.5 million acres while unleashing giant plumes of dense smoke above the rural landscapes.

Cumulative impacts of oil and gas production on watersheds in ND
Cumulative impacts of oil and gas production on watersheds in North Dakota between January 2008 and June 2015. Watershed volumes were calculated by combining reported values of oil, brine, and unidentified liquid waste accidentally released during drilling operations.
Cumulative impacts of oil and gas production on watersheds in North Dakota between January 2008 and June 2015. Watershed volumes were calculated by combining reported values of oil, brine, and unidentified liquid waste accidentally released during drilling operations.

USGS Leetown Science Center Administration Building
Morning snowfall at the Leetown Science Center's Administration building.
Morning snowfall at the Leetown Science Center's Administration building.

Landsat 8, China solar farm, Longyangxia
Landsat 8, Longyangxia solar farm, China, OLI
Landsat 8, Longyangxia solar farm, China, OLI