
This USGS map shows the number of PFAS detected in tap water samples from select sites across the nation. The findings are based on a USGS study of samples taken between 2016 and 2021 from private and public supplies at 716 locations. The map does not represent the only locations in the U.S. with PFAS.
Images
All items in this gallery are considered public domain unless otherwise noted.
Filter Total Items: 518

PFAS in Select U.S. Tapwater Locations
This USGS map shows the number of PFAS detected in tap water samples from select sites across the nation. The findings are based on a USGS study of samples taken between 2016 and 2021 from private and public supplies at 716 locations. The map does not represent the only locations in the U.S. with PFAS.

USGS scientist Mike Tate sets up the mass spectrometer to measure mercury
USGS scientist Mike Tate sets up the mass spectrometer to measure mercuryUSGS scientist Mike Tate sets up the mass spectrometer for mercury isotope measurements.
USGS scientist Mike Tate sets up the mass spectrometer to measure mercury
USGS scientist Mike Tate sets up the mass spectrometer to measure mercuryUSGS scientist Mike Tate sets up the mass spectrometer for mercury isotope measurements.

Scientist collected a stream sample during an urban stormwater runoff event in Seattle, WA
Scientist collected a stream sample during an urban stormwater runoff event in Seattle, WAScientist collected a stream sample during an urban stormwater runoff event in Seattle, WA
Scientist collected a stream sample during an urban stormwater runoff event in Seattle, WA
Scientist collected a stream sample during an urban stormwater runoff event in Seattle, WAScientist collected a stream sample during an urban stormwater runoff event in Seattle, WA
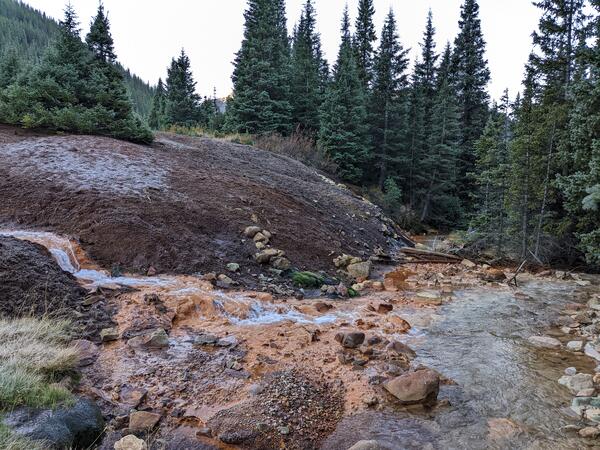
Drainage from a mine carries metals
Both natural and human-related metal mobilization may affect streams. In this photo drainage from a mine enters Cement Creek, near Silverton, Colorado, adjacent to a mound of iron minerals that have likely been forming naturally for thousands of years. Detailed isotopic studies may help to differentiate natural and human-related contamination.
Both natural and human-related metal mobilization may affect streams. In this photo drainage from a mine enters Cement Creek, near Silverton, Colorado, adjacent to a mound of iron minerals that have likely been forming naturally for thousands of years. Detailed isotopic studies may help to differentiate natural and human-related contamination.
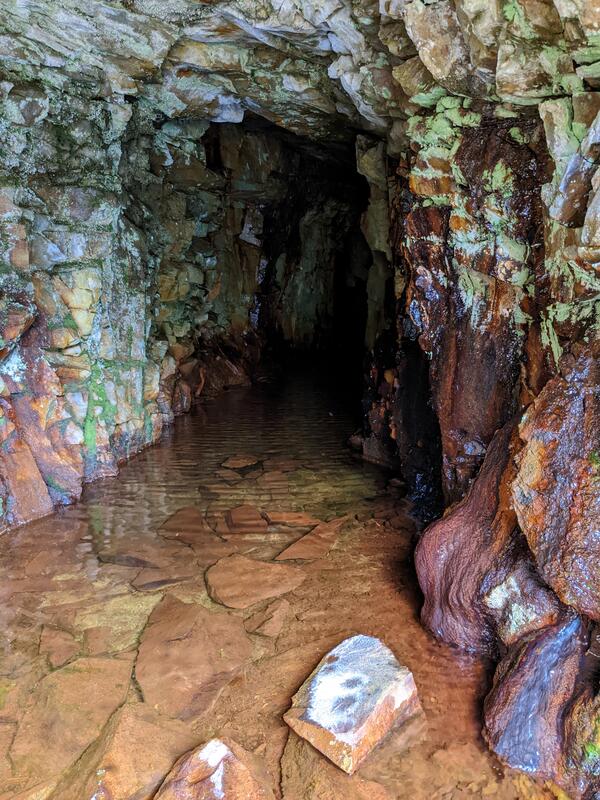
Draining mines provide consistent discharge and have elevated rare earth element concentrations
Draining mines provide consistent discharge and have elevated rare earth element concentrationsDraining mines provide consistent discharge and have elevated rare earth element concentrations, potentially providing opportunities for direct metal production.
Draining mines provide consistent discharge of rare earth element concentrations
Draining mines provide consistent discharge of rare earth element concentrationsDraining mines provide consistent discharge and have elevated rare earth element (REE) concentrations, potentially providing opportunities for direct metal production.

Floating an electromagnetic imaging tool along a coastal area in Massachusetts.
Floating an electromagnetic imaging tool along a coastal area in Massachusetts.Eric White and Patrick Scordato of the USGS float an electromagnetic imaging tool along a coastal area in Massachusetts to identify terrestrial groundwater discharge that may be impacted by PFAS contamination.
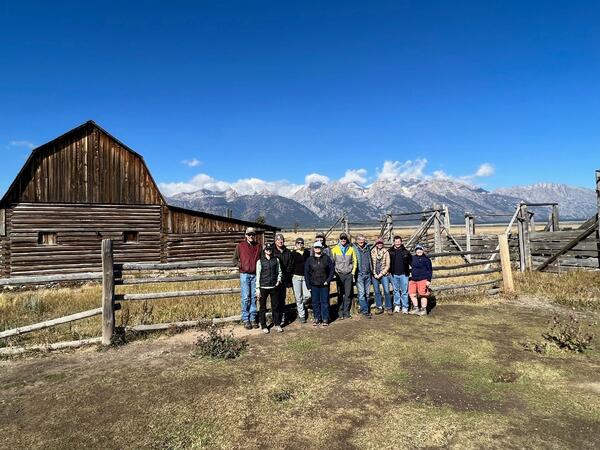
USGS Environmental Health Program Energy Integrated Science Team scientists on field visit
USGS Environmental Health Program Energy Integrated Science Team scientists on field visitUSGS Environmental Health Program Energy Integrated Science Team scientists on field visit within the Grand Teton National Park, September 2022

Samples__20220824_PC_HRW.jpg
Image shows different types of sample containers filled with a variety of sample matrices tested by the OGRL.
Image shows different types of sample containers filled with a variety of sample matrices tested by the OGRL.
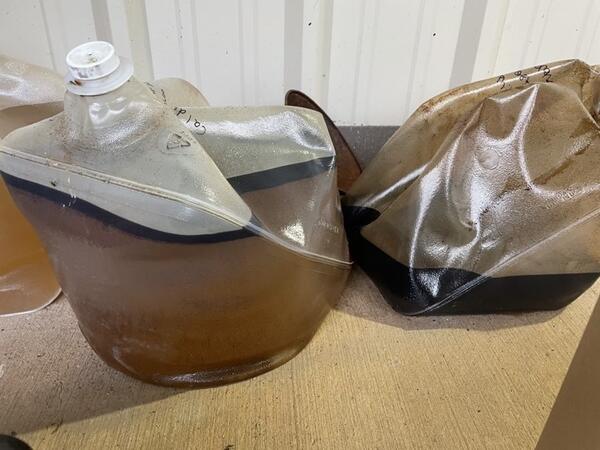
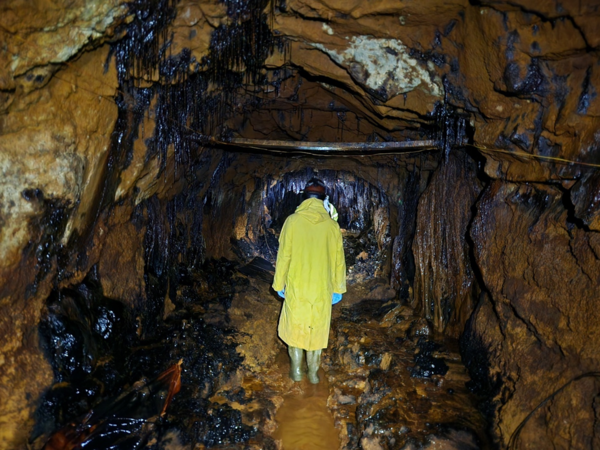
Oily produced water collected from an oil well for U.S. Geological Survey laboratory analysis.
Oily produced water collected from an oil well for U.S. Geological Survey laboratory analysis.Oily produced water collected from an oil well for U.S. Geological Survey laboratory analysis. Photo credit: Bonnie McDevitt.

Source to Receptor Research Framework
Image that shows the research framework for the Environmental Health Program's Source to Receptor Research for Environmental Contaminants
Image that shows the research framework for the Environmental Health Program's Source to Receptor Research for Environmental Contaminants
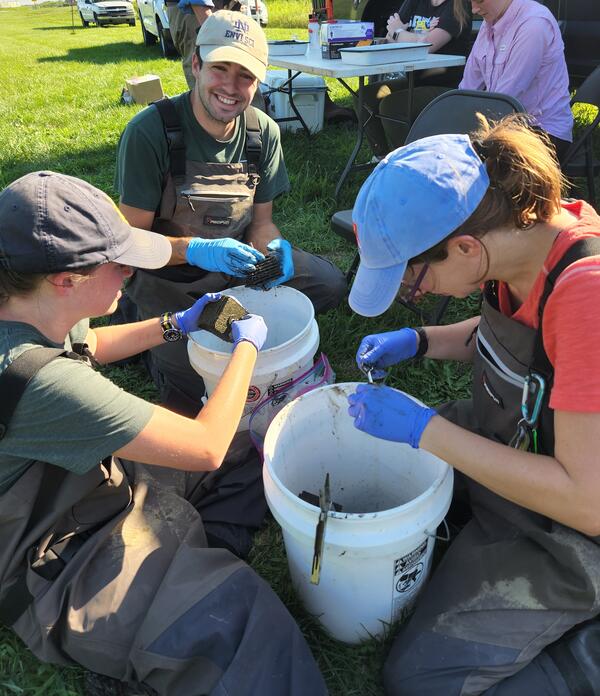
Collection of Aquatic Invertebrates.
Collection of aquatic invertebrates in the field. Photo taken by Laura Hubbard, USGS.
Collection of aquatic invertebrates in the field. Photo taken by Laura Hubbard, USGS.
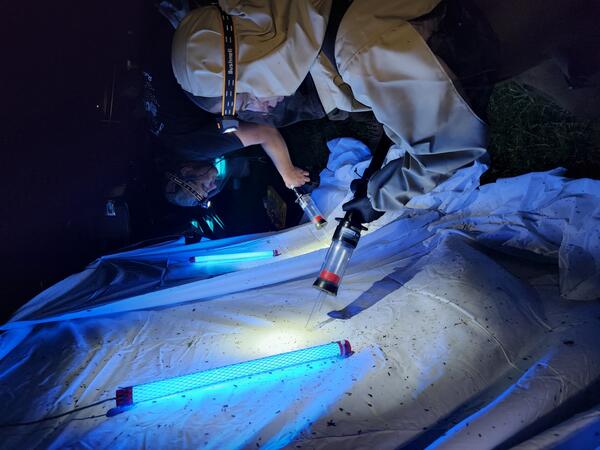
Field Collection of Aquatic Insects at Night
Nighttime collection of adult aquatic insects using a vacuum aspirator on a white sheet illuminated by blacklight. Photo Taken by Laura Hubbard, USGS
Nighttime collection of adult aquatic insects using a vacuum aspirator on a white sheet illuminated by blacklight. Photo Taken by Laura Hubbard, USGS

MI-BaRL scientists prepare samples for analysis to determine bacteria load and the concentration of E. coli and enterococci
MI-BaRL scientists prepare samples for analysis to determine bacteria load and the concentration of E. coli and enterococciMI-BaRL (Lansing, MI) microbiologist JC Wallace (foreground) and biologist Molly Richard (background) prepare samples for analysis to determine bacteria load and the concentration of E. coli and enterococci.

Scientist filters stream water samples for cultivation on selective media for bacteria growth
Scientist filters stream water samples for cultivation on selective media for bacteria growthMichigan Bacteriological Research Laboratory (MI-BaRL) biologist Alexei Rose filters stream water samples for cultivation on selective media for bacteria growth.

Two USGS scientists preparing samples for analysis
Two USGS scientists preparing samples for analysisMichigan Bacterological Research Laboratory (MI-BaRL) microbiologist JC Wallace (foreground) and biologist Molly Richard (background) prepare samples for analysis to determine bacteria load and the concentration of E. coli and enterococci.
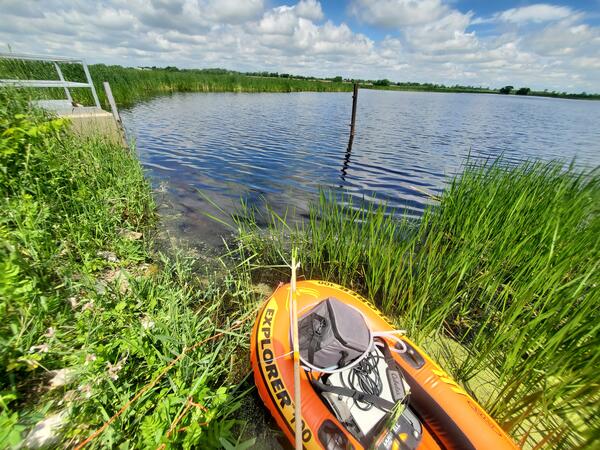
USGS scientists prepare to sample an impoundment at Horicon National Wildlife Refuge, Wisconsin
USGS scientists prepare to sample an impoundment at Horicon National Wildlife Refuge, WisconsinUSGS scientists prepare to sample for environmental AIV at an impoundment at Horicon National Wildlife Refuge, Wisconsin

USGS Scientist sampling water at Horicon National Wildlife Refuge
USGS Scientist sampling water at Horicon National Wildlife RefugeUSGS Hydrologist collecting water from a dock at Horicon National Wildlife Refuge
USGS Scientist sampling water at Horicon National Wildlife Refuge
USGS Scientist sampling water at Horicon National Wildlife RefugeUSGS Hydrologist collecting water from a dock at Horicon National Wildlife Refuge

Soil cores are collected and sectioned to characterize soil properties, abundance of metals, and fallout radionuclides.
Soil cores are collected and sectioned to characterize soil properties, abundance of metals, and fallout radionuclides.Soil cores are collected and sectioned to characterize soil properties, abundance of metals, and fallout radionuclides which can be used to characterize rates of mixing of particles in soil.

Mineral production lifecycle from exploration through reclamation
Mineral production lifecycle from exploration through reclamationArtistic rendition of the mineral lifecycle from a natural state through to exploration, permitting, mining, and reclamation. Designed for the Minerals Lifecycle Integrated Science Team to depict one aspect of their science focus.

Wet mount image of Raphidiopsis sp. collected from Lake Okeechobee
Wet mount image of Raphidiopsis sp. collected from Lake OkeechobeeWet mount image of cyanobacteria, Raphidiopsis sp., collected from Lake Okeechobee, Florida
Wet mount image of Raphidiopsis sp. collected from Lake Okeechobee
Wet mount image of Raphidiopsis sp. collected from Lake OkeechobeeWet mount image of cyanobacteria, Raphidiopsis sp., collected from Lake Okeechobee, Florida