Predicting Pesticide Levels in Streams and Rivers—Where is Water Quality at Risk?
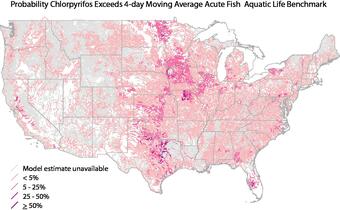
Modeled National Perspective of the Prevalence of Chlorpyrifos
A new interactive mapping tool predicts likely concentrations for 108 pesticides in streams and rivers across the Nation.
The tool can be used to
- create maps showing where pesticides are likely to occur in local streams and rivers, and
- identify which streams and rivers are most likely to exceed water-quality guidelines for human health or aquatic life.

Water-resource managers, environmental professionals, and others can use this information to design cost-effective pesticide monitoring programs and evaluate ecological risks for pesticides.
The online mapping tool is based on a U.S. Geological Survey (USGS) statistical model—referred to as Watershed Regression for Pesticides (WARP)—which estimates concentrations using information on the physical and chemical properties of pesticides, agricultural pesticide use, soil characteristics, hydrology, and climate.
Model estimates are based on pesticide-monitoring data collected since 1992 as part of the USGS National Water-Quality Assessment (NAWQA) Program. The NAWQA Program provides nationally consistent data and models to address where, when, and why the Nation's water quality is degraded and what can be done to improve it for human and ecosystem needs.
This research was funded by the USGS Ecosystems Mission Area’s Environmental Health Program (Contaminant Biology and Toxic Substances Hydrology) and the USGS NAWQA Program provided the funds to develop the online mapping tool.
Below are other science projects associated with this project.
National Water-Quality Assessment (NAWQA)
U.S. Rivers Show Few Signs of Improvement from Historic Nitrate Increases
New Online Tool Tracks Water Quality in the Nation's Rivers and Streams
Public-Supply Well Pumping Regimes Influence Quality of Water Produced
Small Decadal–Scale Changes in Pesticides in Groundwater
USGS Health-Based Screening Levels Available Online
Below are data or web applications associated with this project.
National Water Information System web interface (NWISweb) National Water Information System web interface (NWISweb)
Below are publications associated with this project.
Trends in pesticide concentrations and use for major rivers of the United States Trends in pesticide concentrations and use for major rivers of the United States
Below are data or web applications associated with this project.
National Water Information System (NWIS) Mapper National Water Information System (NWIS) Mapper
A new interactive mapping tool predicts likely concentrations for 108 pesticides in streams and rivers across the Nation.
The tool can be used to
- create maps showing where pesticides are likely to occur in local streams and rivers, and
- identify which streams and rivers are most likely to exceed water-quality guidelines for human health or aquatic life.

Water-resource managers, environmental professionals, and others can use this information to design cost-effective pesticide monitoring programs and evaluate ecological risks for pesticides.
The online mapping tool is based on a U.S. Geological Survey (USGS) statistical model—referred to as Watershed Regression for Pesticides (WARP)—which estimates concentrations using information on the physical and chemical properties of pesticides, agricultural pesticide use, soil characteristics, hydrology, and climate.
Model estimates are based on pesticide-monitoring data collected since 1992 as part of the USGS National Water-Quality Assessment (NAWQA) Program. The NAWQA Program provides nationally consistent data and models to address where, when, and why the Nation's water quality is degraded and what can be done to improve it for human and ecosystem needs.
This research was funded by the USGS Ecosystems Mission Area’s Environmental Health Program (Contaminant Biology and Toxic Substances Hydrology) and the USGS NAWQA Program provided the funds to develop the online mapping tool.
Below are other science projects associated with this project.
National Water-Quality Assessment (NAWQA)
U.S. Rivers Show Few Signs of Improvement from Historic Nitrate Increases
New Online Tool Tracks Water Quality in the Nation's Rivers and Streams
Public-Supply Well Pumping Regimes Influence Quality of Water Produced
Small Decadal–Scale Changes in Pesticides in Groundwater
USGS Health-Based Screening Levels Available Online
Below are data or web applications associated with this project.
National Water Information System web interface (NWISweb) National Water Information System web interface (NWISweb)
Below are publications associated with this project.
Trends in pesticide concentrations and use for major rivers of the United States Trends in pesticide concentrations and use for major rivers of the United States
Below are data or web applications associated with this project.


