
National Park Service and U.S. Geological Survey employees tour the greenhouse in Joshua Tree National Park greenhouse. The plants growing in the Joshua Tree National Park greenhouse will be used for revegetation and restoration efforts in the park.
Images
Images described and linked on this webpage come from a wide variety of USGS science activities and presentations performed by USGS Science Center staff members in the Region 10: California-Great Basin. A search tool is provided to narrow the number of image files shown.
Filter Total Items: 123
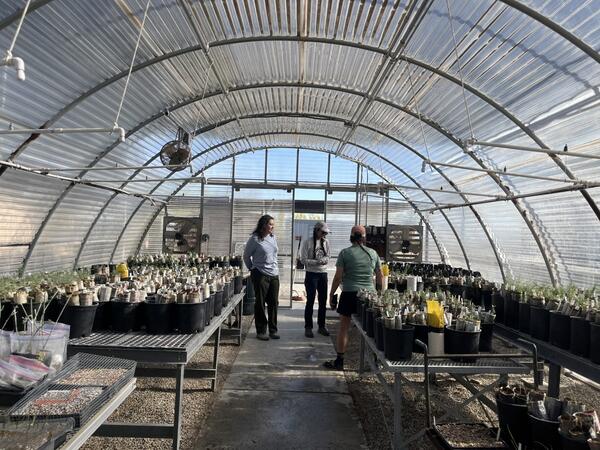
Greenhouse tour at Joshua Tree National Park
National Park Service and U.S. Geological Survey employees tour the greenhouse in Joshua Tree National Park greenhouse. The plants growing in the Joshua Tree National Park greenhouse will be used for revegetation and restoration efforts in the park.
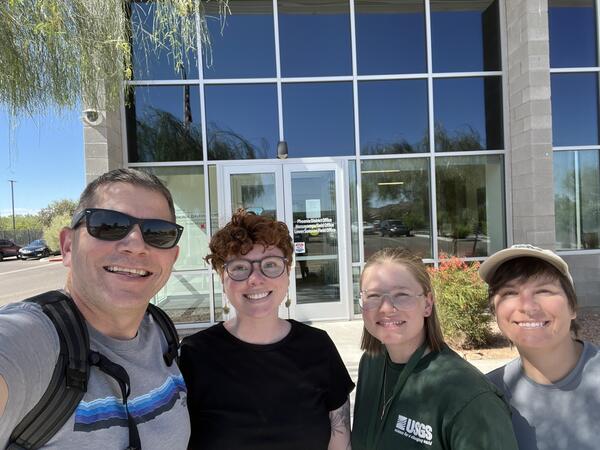
U.S. Geological Survey employees celebrate data collection for the Land Treatment Digital Library
U.S. Geological Survey employees celebrate data collection for the Land Treatment Digital LibraryU.S. Geological Survey employees (from left to right) Matthew Clark, Laura Shriver, Morgan Cheyney, and Sarah Birchard after collecting data for the Land Treatment Digital Library at the Bureau of Land Management Phoenix District Office.
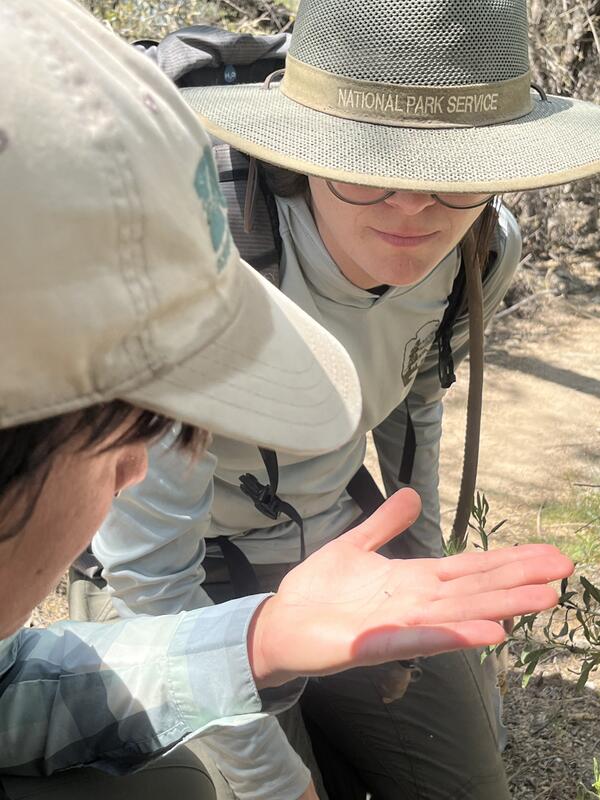
Exploring habitat in Organ Pipe Cactus National Monument
Exploring habitat in Organ Pipe Cactus National MonumentSarah Birchard and Meghan Stan (NPS) explore habitat in Organ Pipe Cactus National Monument (left); A native globemallow plant blooms in the Joshua Tree National Park greenhouse (right). Photos by Laura Shriver (USGS).
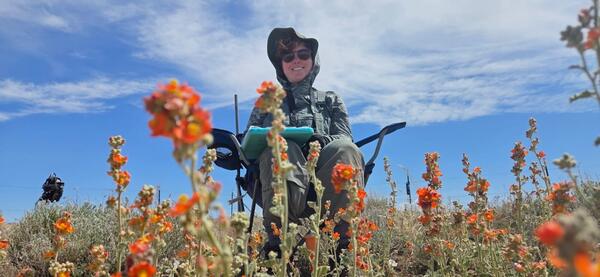
Collecting RestoreNet restoration field trial data in northern Arizona
Collecting RestoreNet restoration field trial data in northern ArizonaUSGS employee Laura Shriver collects RestoreNet data in northern Arizona in a field of native globemallows (Sphaeralcea parvifolia). Photo by Sarah Birchard (USGS).

Celebrating data collection for the Land Treatment Digital Library
Celebrating data collection for the Land Treatment Digital LibraryUSGS employees Matthew Clark, Laura Shriver, Morgan Cheyney, and Sarah Birchard celebrate data collection for the Land Treatment Digital Library at the Phoenix Bureau of Land Management District Office, Arizona.
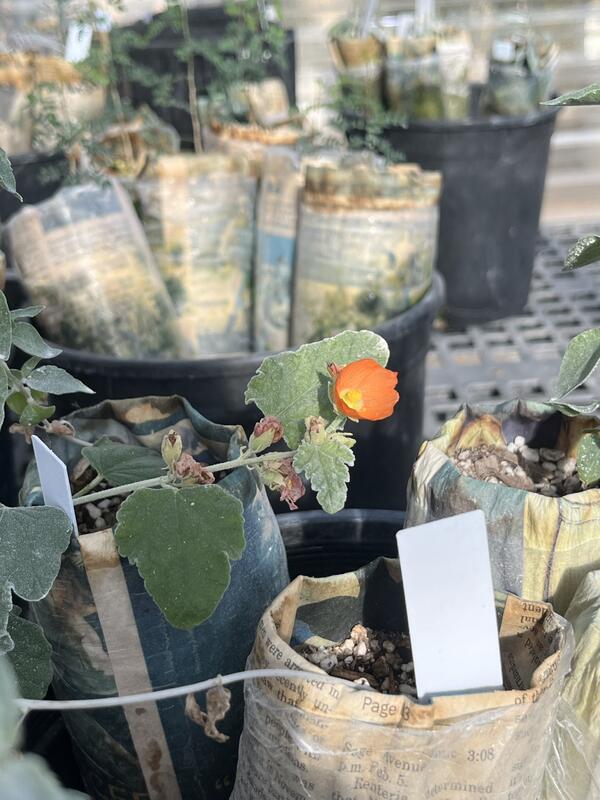
A native globemallow plant blooms in the Joshua Tree National Park greenhouse
A native globemallow plant blooms in the Joshua Tree National Park greenhouseA native globemallow plant blooms in the Joshua Tree National Park greenhouse. Photo by Laura Shriver (USGS).
A native globemallow plant blooms in the Joshua Tree National Park greenhouse
A native globemallow plant blooms in the Joshua Tree National Park greenhouseA native globemallow plant blooms in the Joshua Tree National Park greenhouse. Photo by Laura Shriver (USGS).

U.S. Drought Monitor Drought Conditions Map, National Weather Service Colorado River Basin Forecast Center, April 7, 2026
U.S. Drought Monitor Drought Conditions Map, National Weather Service Colorado River Basin Forecast Center, April 7, 2026Image for the USGS Colorado River Basin Actionable and Strategic Integrated Science and Technology (ASIST) Initiative, geonarrative about the intersection of water use for copper mining and historic drought in the Lower Colorado River Basin (primarily Arizona), April 7, 2026.
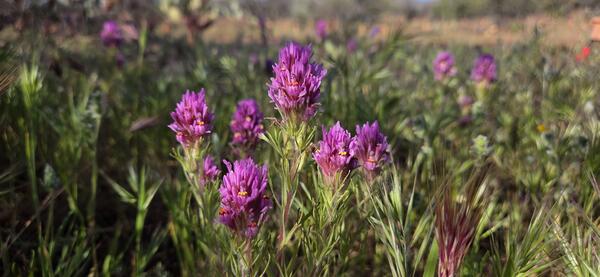
Purple owl’s clover (Castilleja exserta) blooming in the Sonoran Desert
Purple owl’s clover (Castilleja exserta) blooming in the Sonoran DesertPurple owl’s clover (Castilleja exserta) blooming in the Sonoran Desert near Roosevelt Lake in the Tonto National Forest in March 2026. Photo by Sarah Birchard (USGS).
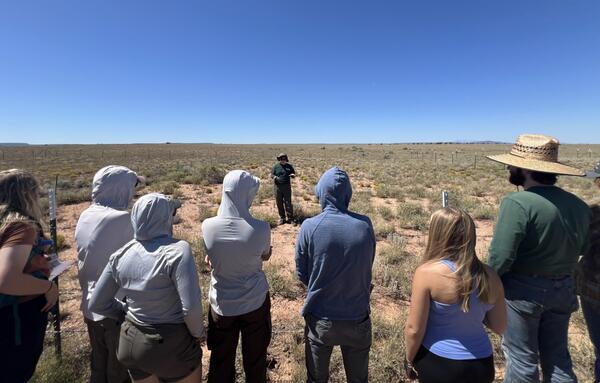
A USGS Ecologist gives a tour of a Northern Arizona RestoreNet site
A USGS Ecologist gives a tour of a Northern Arizona RestoreNet siteLaura Shriver, RAMPS coordinator, gives a tour of a Northern Arizona RestoreNet site to Northern Arizona University students. Photo by Jessica Archibald (Diablo Trust).
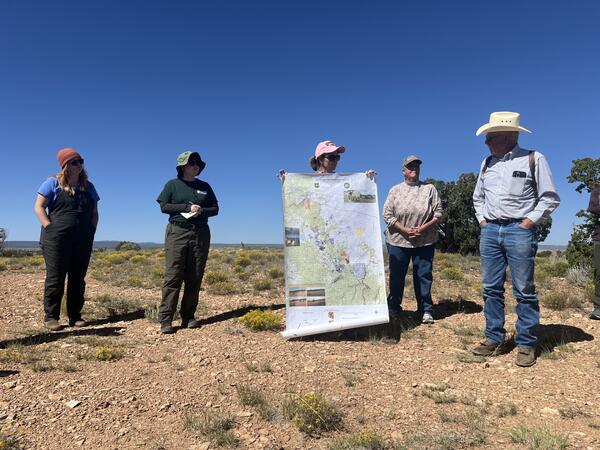
Researchers and ranchers discuss land management in Northern Arizona
Researchers and ranchers discuss land management in Northern ArizonaResearchers from the U.S. Geological Survey and University of Arizona collaborate with Diablo Trust ranchers on range improvement and restoration efforts on Northern Arizona rangelands. Photo by Jessica Archibald (Diablo Trust).
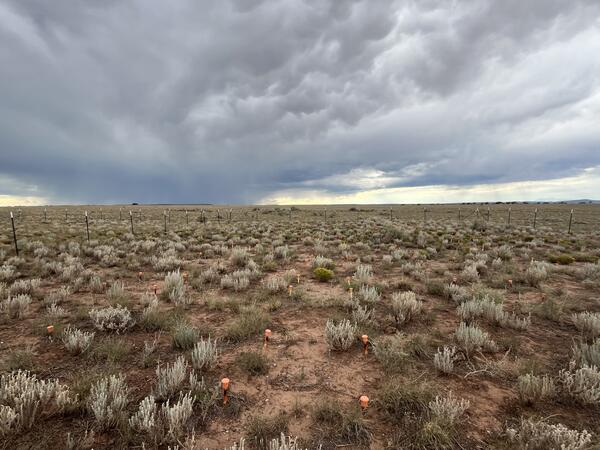
Monsoon season at a Northern Arizona RestoreNet site
Monsoon season at a Northern Arizona RestoreNet siteA RestoreNet site in Northern Arizona with late summer monsoon rain clouds in the background. Photo by Laura Shriver.
Monsoon season at a Northern Arizona RestoreNet site
Monsoon season at a Northern Arizona RestoreNet siteA RestoreNet site in Northern Arizona with late summer monsoon rain clouds in the background. Photo by Laura Shriver.

Flowchart showing relations between porphyry copper mining, drought, water resources, and economic effects
Flowchart showing relations between porphyry copper mining, drought, water resources, and economic effectsSchematic flowchart showing relations between porphyry copper mining, drought, water resources, ecosystems, health, and economic factors in the Lower Colorado River Basin and adjoining areas

Producing porphyry copper deposits and porphyry copper prospects in and near the Lower Colorado River Basin
Producing porphyry copper deposits and porphyry copper prospects in and near the Lower Colorado River BasinMap showing porphyry copper deposits and porphyry copper prospects in and near the Lower Colorado River Basin.

RestoreNet Map
RestoreNet is a networked ecological restoration experiment spanning drylands of the American Southwest. It is engaging diverse partners to develop methods for successful revegetation projects that mitigate the effects of drought, invasion by non-native species, and land use practices.
RestoreNet is a networked ecological restoration experiment spanning drylands of the American Southwest. It is engaging diverse partners to develop methods for successful revegetation projects that mitigate the effects of drought, invasion by non-native species, and land use practices.

Graphs showing water-year total precipitation and air temperatures in the Lower Colorado River Basin from 1896 to 2019
Graphs showing water-year total precipitation and air temperatures in the Lower Colorado River Basin from 1896 to 2019Graphs showing water-year total precipitation and air temperatures in the Lower Colorado River Basin from 1896 to 2019, units modified from millimeters to inches of precipitation and from degrees Celsius to degrees Fahrenheit from: Tillman, F.D., Gangopadhyay, S., and Pruitt, T., 2020, Trends in recent historical and projected climate data for the Colorado River Bas

Pie chart showing proportions of major water use in Arizona in 2015
Pie chart showing proportions of major water use in Arizona in 2015Pie chart showing proportions of major water uses (Agricultural, Municipal, Industrial, and Mining) in Arizona, USA, in 2015
Pie chart showing proportions of major water use in Arizona in 2015
Pie chart showing proportions of major water use in Arizona in 2015Pie chart showing proportions of major water uses (Agricultural, Municipal, Industrial, and Mining) in Arizona, USA, in 2015

A Sonoran Desert RestoreNet site
A RestoreNet Field Trial Network restoration experiment site in the Sonoran Desert, Arizona, in spring 2024. Photo by Laura Shriver (USGS).
A RestoreNet Field Trial Network restoration experiment site in the Sonoran Desert, Arizona, in spring 2024. Photo by Laura Shriver (USGS).
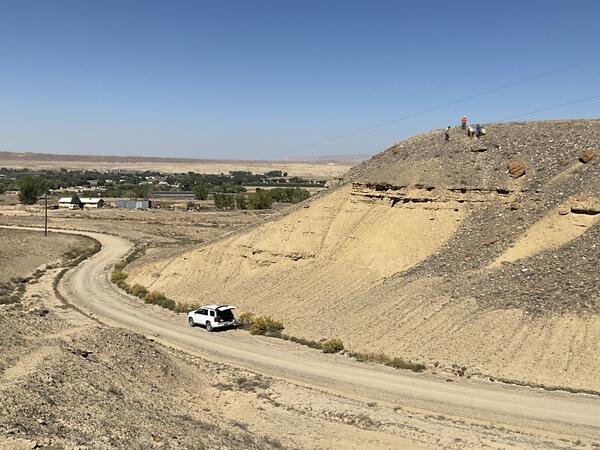
Photograph showing sampling high terraces along the San Juan River
Photograph showing sampling high terraces along the San Juan RiverCharacterizing geochemistry, provenance, and age of river terrace deposits to identify potential changes in the distribution, concentration, and sources of critical minerals and contaminants through the geologic past and into the present following mining activities.

Canyonlands Research Center
Scenic view of the red rock mesas surrounding Canyonlands Research Center (The Nature Conservancy) in southern Utah.
Scenic view of the red rock mesas surrounding Canyonlands Research Center (The Nature Conservancy) in southern Utah.

RestoreNet livestock treatments
Cattle inside a grazing enclosure at Canyonlands Research Center (The Nature Conservancy) in southern Utah.
Cattle inside a grazing enclosure at Canyonlands Research Center (The Nature Conservancy) in southern Utah.

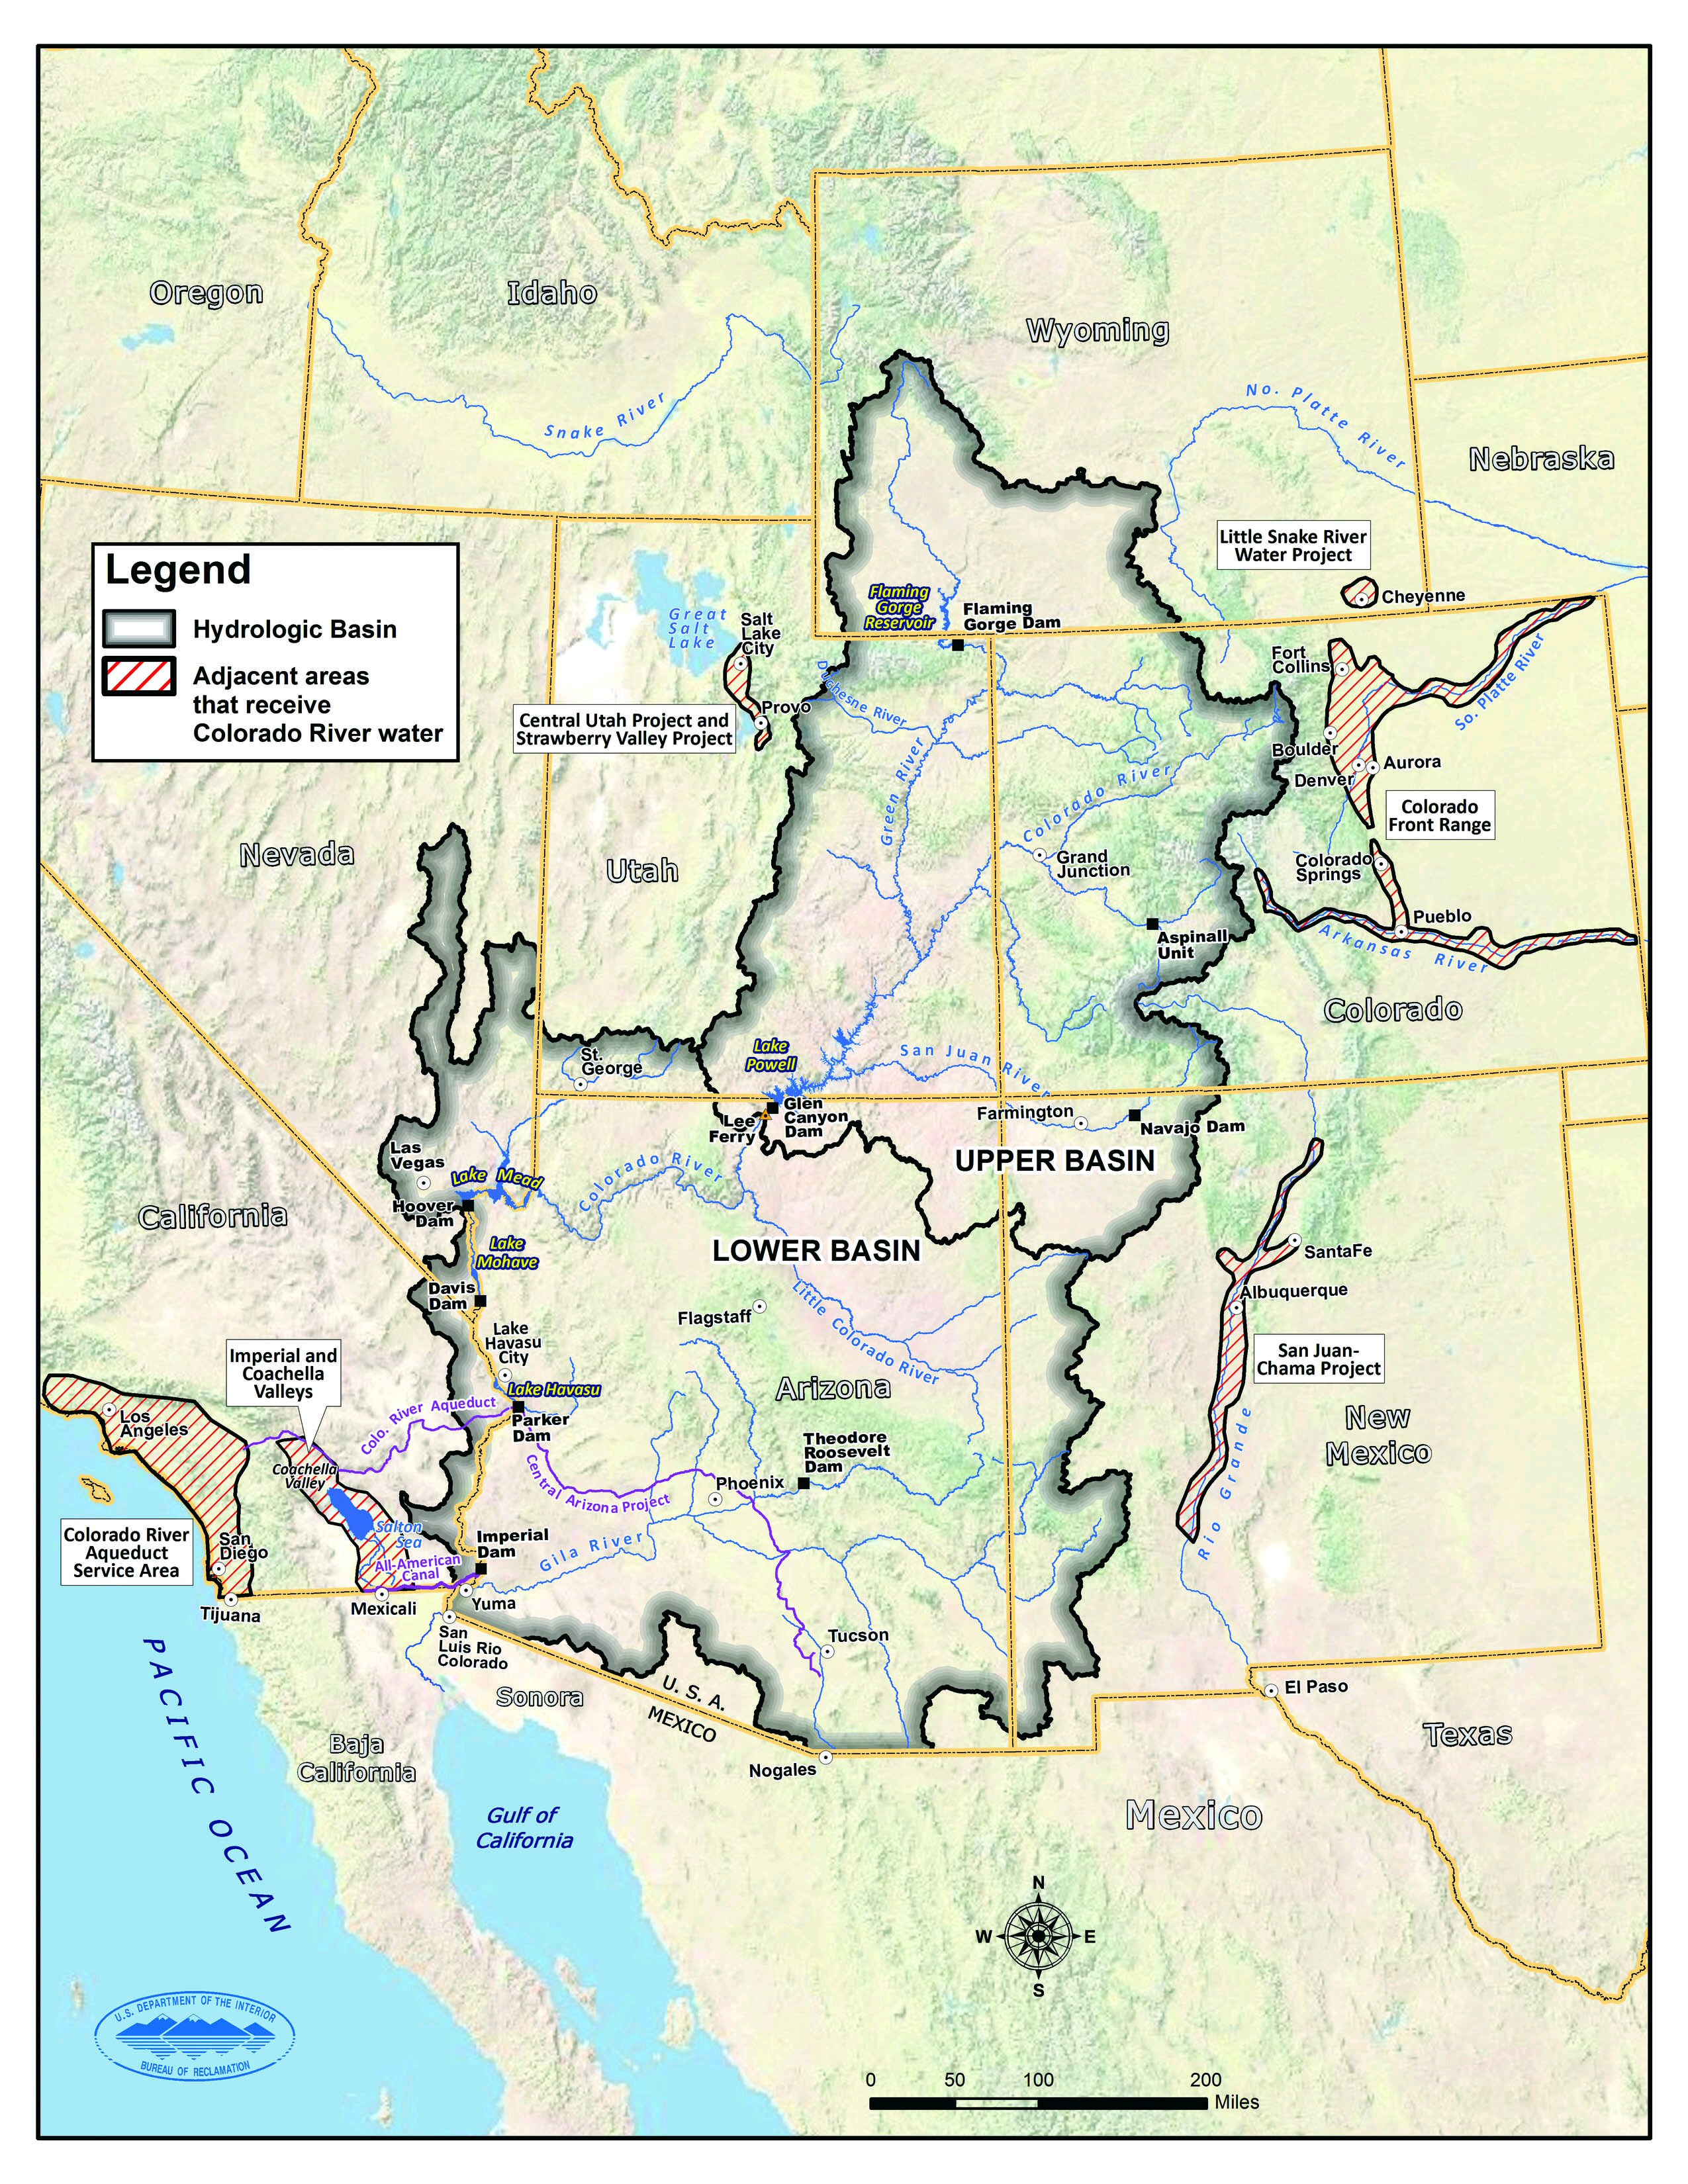
U.S. Bureau of Reclamation Map of the Colorado River Basin
U.S. Bureau of Reclamation Map of the Colorado River BasinU.S. Bureau of Reclamation map of the Colorado River Basin accessed on October 15, 2024, at URL: CRBSmap.jpg (2550×3300) (usbr.gov)
U.S. Bureau of Reclamation Map of the Colorado River Basin
U.S. Bureau of Reclamation Map of the Colorado River BasinU.S. Bureau of Reclamation map of the Colorado River Basin accessed on October 15, 2024, at URL: CRBSmap.jpg (2550×3300) (usbr.gov)