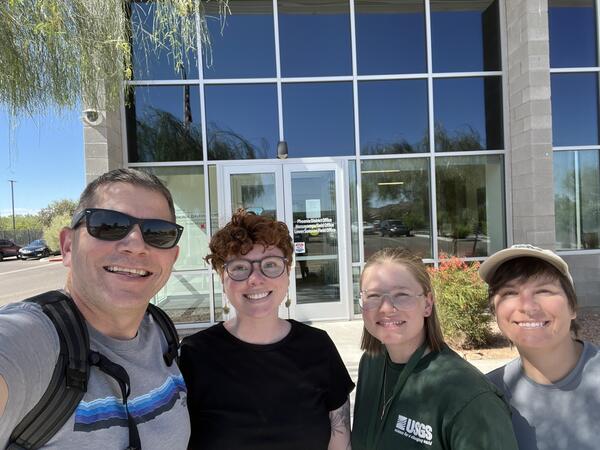
U.S. flag

An official website of the United States government

Multimedia

Photos, videos, audio files, and webcam photos described and linked on this webpage come from a wide variety of USGS science activities and presentations done by USGS Science Center staff members in the Southwest Region. 

Images

Graphs showing water-year total precipitation and air temperatures in the Lower Colorado River Basin from 1896 to 2019

Graphs showing water-year total precipitation and air temperatures in the Lower Colorado River Basin from 1896 to 2019, units modified from millimeters to inches of precipitation and from degrees Celsius to degrees Fahrenheit from: Tillman, F.D., Gangopadhyay, S., and Pruitt, T., 2020, Trends in recent historical and projected climate data for the Colorado River Bas

Graphs showing water-year total precipitation and air temperatures in the Lower Colorado River Basin from 1896 to 2019, units modified from millimeters to inches of precipitation and from degrees Celsius to degrees Fahrenheit from: Tillman, F.D., Gangopadhyay, S., and Pruitt, T., 2020, Trends in recent historical and projected climate data for the Colorado River Bas

Pie chart of percentages of major water uses--Agricultural, Municipal, Industrial, and Mining in Arizona, USA, 2015
Pie chart showing proportions of major water use in Arizona in 2015

Pie chart showing proportions of major water uses (Agricultural, Municipal, Industrial, and Mining) in Arizona, USA, in 2015

Scenic view of red rock mesas surrounding Canyonlands Research Center in Southern Utah
Canyonlands Research Center

Scenic view of the red rock mesas surrounding Canyonlands Research Center (The Nature Conservancy) in southern Utah.

Scenic view of the red rock mesas surrounding Canyonlands Research Center (The Nature Conservancy) in southern Utah.

Five cattle graze on experimental RestoreNet plots in a southern Utah landscape
RestoreNet livestock treatments

Cattle inside a grazing enclosure at Canyonlands Research Center (The Nature Conservancy) in southern Utah.

Cattle inside a grazing enclosure at Canyonlands Research Center (The Nature Conservancy) in southern Utah.

Diagram showing the flow of water for conventional flotation processing of copper ores (Bleiwas, 2012)
Schematic Diagram of Water Flow for Conventional Flotation Processing of Copper Ores (Bleiwas, 2012)

Schematic diagram of water flow for conventional flotation processing of copper ores from Bleiwas, D.I., 2012, Estimated water requirements for the conventional flotation of copper ores: U.S. Geological Survey Open-File Report 2012–1089, 13 p., available at https://pubs.usgs.gov/publication/ofr20121089

U.S. Bureau of Reclamation map showing boundaries and features of the Colorado River Basin
U.S. Bureau of Reclamation Map of the Colorado River Basin

U.S. Bureau of Reclamation map of the Colorado River Basin accessed on October 15, 2024, at URL: CRBSmap.jpg (2550×3300) (usbr.gov)

Videos

Landsat's 12 Millionth Image - Image of the Week Landsat's 12 Millionth Image (Image of the Week)
Landsat's 12 Millionth Image (Image of the Week)

The USGS EROS Landsat archive recently reached a milestone of 12 million Landsat Collection 2 Level-1 products. These are available for download at no charge. The image representing this milestone displays a sprawling desert landscape and contains a multitude of agricultural, geological, and urban features.

The USGS EROS Landsat archive recently reached a milestone of 12 million Landsat Collection 2 Level-1 products. These are available for download at no charge. The image representing this milestone displays a sprawling desert landscape and contains a multitude of agricultural, geological, and urban features.

Text: Can these rocks reduce flooding? with an image of Laura Norman and a two men standing on a gabion in the background. Can these rocks reduce flooding? (English captions)
Can these rocks reduce flooding? (English captions)

Creating a binational sponge city in the desert: Flooding in the binational cities at Ambos Nogales on the Arizona-Sonora portion of the US-Mexico border has caused damage, ruined livelihoods and taken lives for hundreds of years.

Creating a binational sponge city in the desert: Flooding in the binational cities at Ambos Nogales on the Arizona-Sonora portion of the US-Mexico border has caused damage, ruined livelihoods and taken lives for hundreds of years.

Text: Can these rocks reduce flooding? with an image of Laura Norman and a two men standing on a gabion in the background. Can these rocks reduce flooding? (Spanish captions)
Can these rocks reduce flooding? (Spanish captions)

Flooding in the binational cities at Ambos Nogales on the Arizona-Sonora portion of the US-Mexico border has caused damage, ruined livelihoods and taken lives for hundreds of years.

Flooding in the binational cities at Ambos Nogales on the Arizona-Sonora portion of the US-Mexico border has caused damage, ruined livelihoods and taken lives for hundreds of years.

Loma Prieta ShakeMovie ShakeMovie Animation: 1989 M6.9 Loma Prieta Earthquake
ShakeMovie Animation: 1989 M6.9 Loma Prieta Earthquake

The 1989 Loma Prieta earthquake, measuring magnitude 6.9, was the strongest to hit the San Francisco Bay Area since the Great San Francisco earthquake of 1906. Although it provided extensive data on ground shaking, the available observations don’t fully capture all the quake's important features. 

The 1989 Loma Prieta earthquake, measuring magnitude 6.9, was the strongest to hit the San Francisco Bay Area since the Great San Francisco earthquake of 1906. Although it provided extensive data on ground shaking, the available observations don’t fully capture all the quake's important features. 

A male desert bighorn sheep near a water catchment in the Sonoran Desert, Cabeza Prieta National Wildlife Refuge Desert bighorn sheep in Cabeza Prieta National Wildlife Refuge
Desert bighorn sheep in Cabeza Prieta National Wildlife Refuge

A group of desert bighorn sheep (Ovis canadensis mexicana) interact near a water catchment, also known as a tinaja, in the Sonoran Desert, Cabeza Prieta National Wildlife Refuge, southern Arizona.

A group of desert bighorn sheep (Ovis canadensis mexicana) interact near a water catchment, also known as a tinaja, in the Sonoran Desert, Cabeza Prieta National Wildlife Refuge, southern Arizona.

Cover image for sediment core lab video, showing core-lab walk-in refrigerator USGS Sediment Core Laboratory (AD)
USGS Sediment Core Laboratory (AD)

USGS scientists collect core samples from estuaries, lakes, coasts, and marine environments to study a range of physical and chemical properties preserved in sediment or coral over time. They process and analyze these core samples at the Pacific Coastal and Marine Science Center’s Sediment Core Lab. 

USGS scientists collect core samples from estuaries, lakes, coasts, and marine environments to study a range of physical and chemical properties preserved in sediment or coral over time. They process and analyze these core samples at the Pacific Coastal and Marine Science Center’s Sediment Core Lab. 

Was this page helpful?