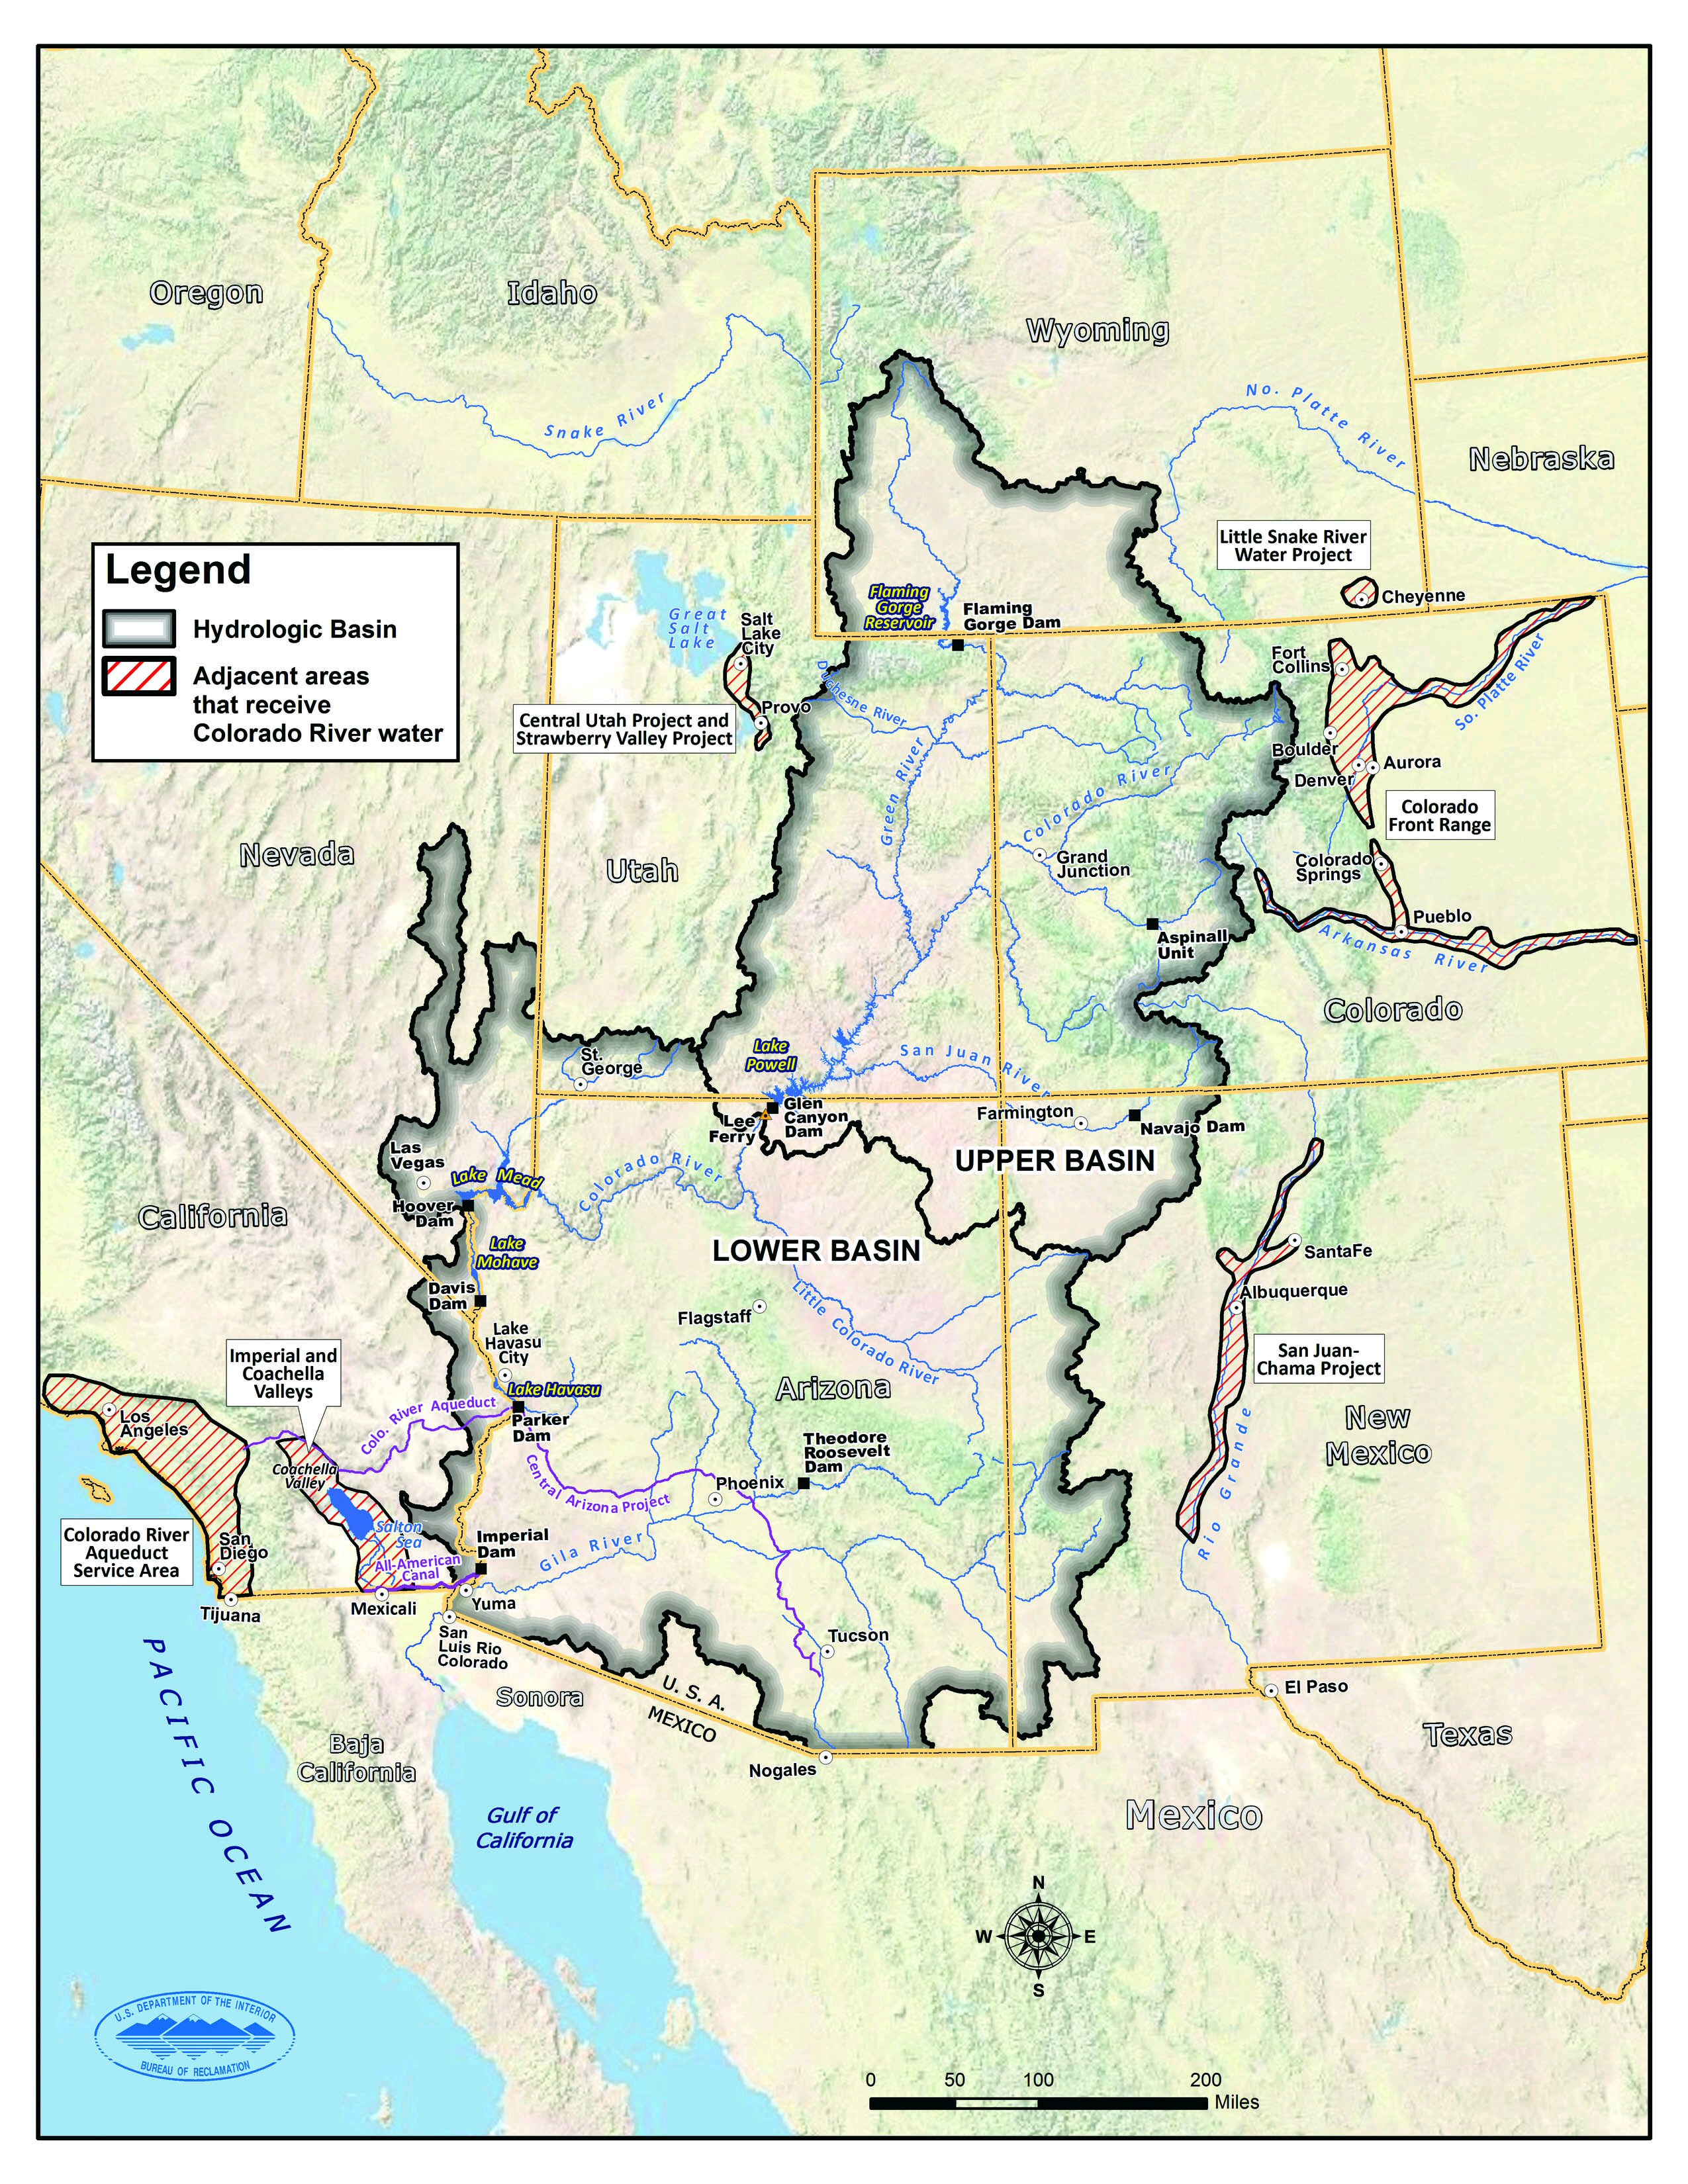
U.S. Bureau of Reclamation Map of the Colorado River Basin
U.S. Bureau of Reclamation Map of the Colorado River BasinU.S. Bureau of Reclamation map of the Colorado River Basin accessed on October 15, 2024, at URL: CRBSmap.jpg (2550×3300) (usbr.gov)


Official websites use .gov
A .gov website belongs to an official government organization in the United States.

Secure .gov websites use HTTPS
A lock () or https:// means you’ve safely connected to the .gov website. Share sensitive information only on official, secure websites.

Images described and linked on this webpage come from a wide variety of USGS science activities and presentations performed by USGS Science Center staff members in the Region 10: California-Great Basin. A search tool is provided to narrow the number of image files shown.

U.S. Bureau of Reclamation map of the Colorado River Basin accessed on October 15, 2024, at URL: CRBSmap.jpg (2550×3300) (usbr.gov)
U.S. Bureau of Reclamation map of the Colorado River Basin accessed on October 15, 2024, at URL: CRBSmap.jpg (2550×3300) (usbr.gov)

Desert marigold (Baileya multiradiata) blooming in a monitoring quadrat at a RestoreNet site in Northern Arizona. Photo by Laura Shriver (USGS).
Desert marigold (Baileya multiradiata) blooming in a monitoring quadrat at a RestoreNet site in Northern Arizona. Photo by Laura Shriver (USGS).

Aerial photo of attendees at the 6th Federal Uncrewed Systems (UxS) Workshop taken from a Skydio drone in front of the Science and Technology building at the Southwestern Indian Polytechnic Institute, Albuquerque, New Mexico.
Aerial photo of attendees at the 6th Federal Uncrewed Systems (UxS) Workshop taken from a Skydio drone in front of the Science and Technology building at the Southwestern Indian Polytechnic Institute, Albuquerque, New Mexico.

Pie chart showing relative amounts of copper produced by leading copper producing states in the U.S. in 2019 (derived from data in Flanagan, D.M., 2019, Copper, in Metals and minerals: U.S. Geological Survey Minerals Yearbook 2019, v. 1, p. 20.1-20.30.
Pie chart showing relative amounts of copper produced by leading copper producing states in the U.S. in 2019 (derived from data in Flanagan, D.M., 2019, Copper, in Metals and minerals: U.S. Geological Survey Minerals Yearbook 2019, v. 1, p. 20.1-20.30.

Graphs showing mean annual precipitation and air temperature trends in the Lower Colorado River Basin, 1896-2019, published in: Tillman, F.D., Gangopadhyay, S., and Pruitt, T., 2020, Trends in recent historical and projected climate data for the Colorado River Basin and potential effects on groundwater availability: U.S.
Graphs showing mean annual precipitation and air temperature trends in the Lower Colorado River Basin, 1896-2019, published in: Tillman, F.D., Gangopadhyay, S., and Pruitt, T., 2020, Trends in recent historical and projected climate data for the Colorado River Basin and potential effects on groundwater availability: U.S.

Reduced-size map of the Colorado River Basin from the USGS ASIST Initiative, Sept. 3, 2024
Reduced-size map of the Colorado River Basin from the USGS ASIST Initiative, Sept. 3, 2024

Map of the Colorado River Basin in Wyoming, Colorado, Utah, Nevada, California, Arizona, and New Mexico
Map of the Colorado River Basin in Wyoming, Colorado, Utah, Nevada, California, Arizona, and New Mexico

Large map of the Colorado River Basin prepared for the USGS Colorado River Basin ASIST Initiative
Large map of the Colorado River Basin prepared for the USGS Colorado River Basin ASIST Initiative

USGS Biological Science Technician Claudia Dimartini poses with a long camelthorn (Alhagi maurorum) rhizome (underground root structure from which new plants can propagate that was exposed in a wash at the Deadman Wash Confluence Area. Photo by Laura Shriver (USGS).
USGS Biological Science Technician Claudia Dimartini poses with a long camelthorn (Alhagi maurorum) rhizome (underground root structure from which new plants can propagate that was exposed in a wash at the Deadman Wash Confluence Area. Photo by Laura Shriver (USGS).
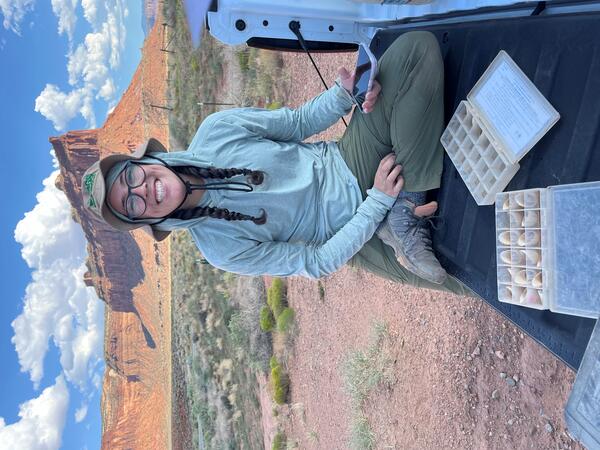
Sarah Costanzo (USGS) collects soil stability data prior to installing RestoreNet version 2.0 treatments at Canyonlands Research Center near Moab, UT. Photo by Laura Shriver (USGS).
Sarah Costanzo (USGS) collects soil stability data prior to installing RestoreNet version 2.0 treatments at Canyonlands Research Center near Moab, UT. Photo by Laura Shriver (USGS).

From left to right, Ember Bradbury (Colorado State University), Sarah Costanzo (USGS), Sonoma Brill (USGS), and Laura Shriver (USGS) celebrate installing a RestoreNet site at Canyonlands Research Center near Moab, UT.
From left to right, Ember Bradbury (Colorado State University), Sarah Costanzo (USGS), Sonoma Brill (USGS), and Laura Shriver (USGS) celebrate installing a RestoreNet site at Canyonlands Research Center near Moab, UT.
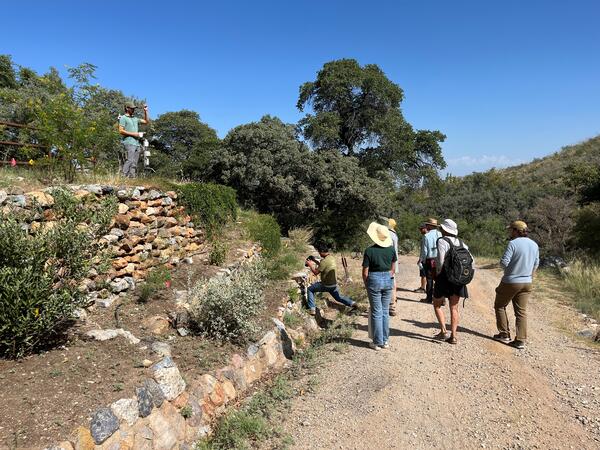
Albert Klein (University of Arizona) shows the pollinator garden designed and installed by University of Arizona students at the Santa Rita Experimental Range. Photo by Laura Shriver (USGS).
Albert Klein (University of Arizona) shows the pollinator garden designed and installed by University of Arizona students at the Santa Rita Experimental Range. Photo by Laura Shriver (USGS).

Laura Shriver at the soil and restoration science booth at the USGS Flagstaff Science Center Open House. The booth included native seeds, biocrusts, a soil texturing activity, and science brief handouts.
Laura Shriver at the soil and restoration science booth at the USGS Flagstaff Science Center Open House. The booth included native seeds, biocrusts, a soil texturing activity, and science brief handouts.

Photograph of Ray Copper Mine, Arizona, taken by USGS Emeritus Mark Coker, September 1, 2007. Revised for USGS Webpage carousel for brightness, sharpness, contrast, color saturation, and cropping.
Photograph of Ray Copper Mine, Arizona, taken by USGS Emeritus Mark Coker, September 1, 2007. Revised for USGS Webpage carousel for brightness, sharpness, contrast, color saturation, and cropping.

Graphs showing trends in atmospheric precipitation and air temperature in the Lower Colorado River Basin, 1896-2019
Graphs showing trends in atmospheric precipitation and air temperature in the Lower Colorado River Basin, 1896-2019

Pie chart showing copper production in leading copper producing U.S. states in 2020 by Eric Anderson of the Geology, Geophysics, and Geochemistry Science Center, August 2024
Pie chart showing copper production in leading copper producing U.S. states in 2020 by Eric Anderson of the Geology, Geophysics, and Geochemistry Science Center, August 2024

Table of annual water use in acre-feet per year by major copper mines in Arizona from 2004-2008 published by Singh (2010)
Table of annual water use in acre-feet per year by major copper mines in Arizona from 2004-2008 published by Singh (2010)

Map showing locations of copper producing mines in the Lower Colorado River Basin, produced by Eric Anderson of the Geology, Geophysics, and Geochemistry Science Center on August 19, 2024.
Map showing locations of copper producing mines in the Lower Colorado River Basin, produced by Eric Anderson of the Geology, Geophysics, and Geochemistry Science Center on August 19, 2024.

Goose Lake, on the Oregon-California border, is one of the 20 terminal lakes identified by USGS partners as priority ecosystems for study by the Saline Lakes Ecosystems IWAA.
Goose Lake, on the Oregon-California border, is one of the 20 terminal lakes identified by USGS partners as priority ecosystems for study by the Saline Lakes Ecosystems IWAA.

Cattle inside a grazing enclosure at the Bar T Bar Ranch RestoreNet site in Northern Arizona.
Cattle inside a grazing enclosure at the Bar T Bar Ranch RestoreNet site in Northern Arizona.

Newly installed RestoreNet Version 2.0 treatment plots at Bar T Bar Ranch in Northern Arizona. Left: a plot that received pitting + seedballs + live topsoil inoculum (in the seedballs), Right: a plot that received live topsoil inoculum (spread across the plot) and direct seeding.
Newly installed RestoreNet Version 2.0 treatment plots at Bar T Bar Ranch in Northern Arizona. Left: a plot that received pitting + seedballs + live topsoil inoculum (in the seedballs), Right: a plot that received live topsoil inoculum (spread across the plot) and direct seeding.