Installation of GPS mast at station BRSP on Mount Hood
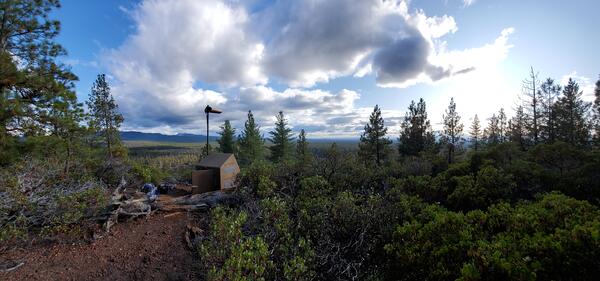
Installation of GPS mast at station BRSP on Mount HoodUSGS Cascades Volcano Observatory Geophysicist Emily Montgomery-Brown uses a drill to create a small hole in volcanic rock that will support a GPS mast. The effort was part of a three-station installation project at Mount Hood in 2020. This station location is called BRSP.