



Smallmouth Bass are good indicators of methylmercury exposure to humans and wildlife because they are a common, popular sport fish and eat a variety of food during their lifetime. Juvenile Smallmouth Bass – smaller than 150mm in length - eat zooplankton, or microscopic animals.
Images
Images intro.
Filter Total Items: 262

Smallmouth Bass
Smallmouth Bass are good indicators of methylmercury exposure to humans and wildlife because they are a common, popular sport fish and eat a variety of food during their lifetime. Juvenile Smallmouth Bass – smaller than 150mm in length - eat zooplankton, or microscopic animals.

Wave reduction barriers and a wind sensor in Malheur Lake
Wave reduction barriers and a wind sensor in Malheur LakeWave reduction barriers were installed around some mesocosms to test whether reducing wind-wave action would reduce suspended sediment in the water column.
Wave reduction barriers and a wind sensor in Malheur Lake
Wave reduction barriers and a wind sensor in Malheur LakeWave reduction barriers were installed around some mesocosms to test whether reducing wind-wave action would reduce suspended sediment in the water column.

Map with Southwest Region Boundary
USGS Southwest Region boundary encompassing California, Arizone, Nevada, and a small portion of Oregon overlain on a colorized digital elevation model.
USGS Southwest Region boundary encompassing California, Arizone, Nevada, and a small portion of Oregon overlain on a colorized digital elevation model.

Map of Southwest Region Boundary
Map of Southwest Region generated from ArcGIS Pro using public domain layers from AGOL at 1:20M scale.
Map of Southwest Region generated from ArcGIS Pro using public domain layers from AGOL at 1:20M scale.
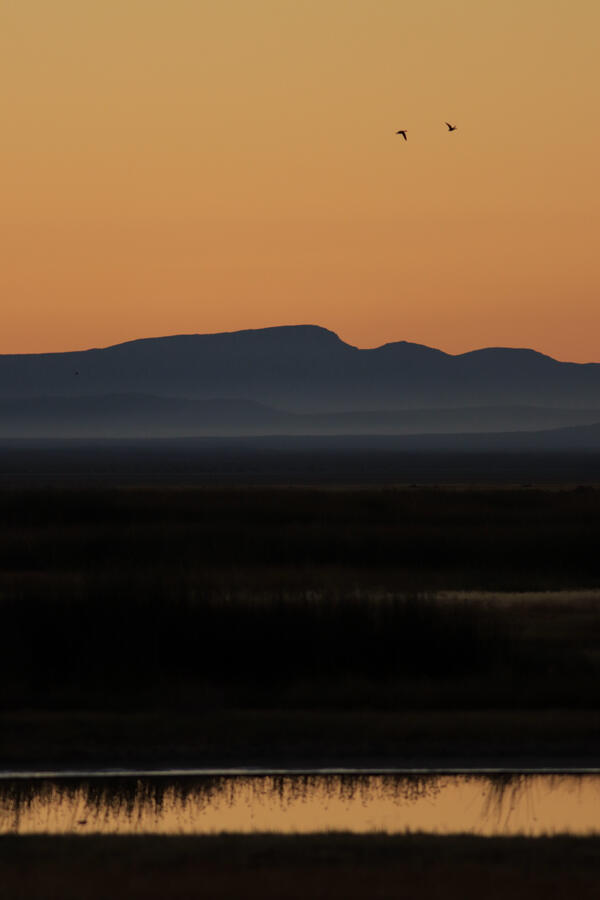
Summer Lake Wildlife Area
Photograph of Summer Lake Wildlife Area, an important stopping spot for migratory birds on their spring and fall migration flights.
By
Ecosystems Mission Area, Water Resources Mission Area, Species Management Research Program, Forest and Rangeland Ecosystem Science Center, Fort Collins Science Center, Nevada Water Science Center, Utah Water Science Center, Western Ecological Research Center (WERC), Saline Lake Ecosystems Integrated Water Availability Assessment
Photograph of Summer Lake Wildlife Area, an important stopping spot for migratory birds on their spring and fall migration flights.
By
Ecosystems Mission Area, Water Resources Mission Area, Species Management Research Program, Forest and Rangeland Ecosystem Science Center, Fort Collins Science Center, Nevada Water Science Center, Utah Water Science Center, Western Ecological Research Center (WERC), Saline Lake Ecosystems Integrated Water Availability Assessment

Crater Lake, Oregon - 4 Topo comparison maps
The image is a composite of four screenshots comparing four USGS topographic maps. The large screenshot at the top half of the image is an area around Crater Lake, Oregon, with a 1:100K US Topo sample at full resolution.
The image is a composite of four screenshots comparing four USGS topographic maps. The large screenshot at the top half of the image is an area around Crater Lake, Oregon, with a 1:100K US Topo sample at full resolution.

Principal aquifers and wells assessed in nationwide NAWQA/GAMA groundwater quality study
Principal aquifers and wells assessed in nationwide NAWQA/GAMA groundwater quality studyMap showing principal aquifers (PAs) and wells that were sampled as part of a Nationwide assessment of the quality of groundwater used for public supply.
Principal aquifers and wells assessed in nationwide NAWQA/GAMA groundwater quality study
Principal aquifers and wells assessed in nationwide NAWQA/GAMA groundwater quality studyMap showing principal aquifers (PAs) and wells that were sampled as part of a Nationwide assessment of the quality of groundwater used for public supply.

Lone goose at sunrise at Summer Lake Wildlife Area
Lone goose at sunrise at Summer Lake Wildlife AreaLooking east on Bullgate Pond at sunrise with lone tule white-fronted goose (Anser albifrons elgasi) in upper right, Summer Lake Wildlife Area, near Summer Lake, Oregon.
By
Ecosystems Mission Area, Water Resources Mission Area, Species Management Research Program, Water Availability and Use Science Program, Forest and Rangeland Ecosystem Science Center, Fort Collins Science Center, Nevada Water Science Center, Oregon Water Science Center, Utah Water Science Center, Western Ecological Research Center (WERC), Saline Lake Ecosystems Integrated Water Availability Assessment
Lone goose at sunrise at Summer Lake Wildlife Area
Lone goose at sunrise at Summer Lake Wildlife AreaLooking east on Bullgate Pond at sunrise with lone tule white-fronted goose (Anser albifrons elgasi) in upper right, Summer Lake Wildlife Area, near Summer Lake, Oregon.
By
Ecosystems Mission Area, Water Resources Mission Area, Species Management Research Program, Water Availability and Use Science Program, Forest and Rangeland Ecosystem Science Center, Fort Collins Science Center, Nevada Water Science Center, Oregon Water Science Center, Utah Water Science Center, Western Ecological Research Center (WERC), Saline Lake Ecosystems Integrated Water Availability Assessment

Installing natural infrastructure can impact the water and carbon budgets of dryland streams and watersheds
Installing natural infrastructure can impact the water and carbon budgets of dryland streams and watershedsAn illustration of a mountain with water flowing from the top down to a river with smaller rivers flowing off the sides. Multiple items appear along the various rivers including leaky weirs, one rock dams, log dams, gabions, check dams, trincheras, and earthen berms. Informational bubbles appear alongside these various item in the illustration.
Installing natural infrastructure can impact the water and carbon budgets of dryland streams and watersheds
Installing natural infrastructure can impact the water and carbon budgets of dryland streams and watershedsAn illustration of a mountain with water flowing from the top down to a river with smaller rivers flowing off the sides. Multiple items appear along the various rivers including leaky weirs, one rock dams, log dams, gabions, check dams, trincheras, and earthen berms. Informational bubbles appear alongside these various item in the illustration.

Route of the Nez Perce in 1877
Route followed by a band of Nez Perce (or, in their language, Nimiipu or Nee-Me-Poo) in 1877.
Route followed by a band of Nez Perce (or, in their language, Nimiipu or Nee-Me-Poo) in 1877.

Airborne Geophysical Survey Helicopter with Cow
A helicopter rigged with an airborne geophysical survey collecting equipment. Information collected during these surveys can help with studying critical mineral resources, natural hazards and groundwater potential. A cow is here too.
A helicopter rigged with an airborne geophysical survey collecting equipment. Information collected during these surveys can help with studying critical mineral resources, natural hazards and groundwater potential. A cow is here too.

Airborne Geophysical Survey Helicopter in Nevada
A low-flying helicopter towing a geophysical device collects scientific data on groundwater and geology. Information collected during these surveys can help with studying critical mineral resources, natural hazards and groundwater potential.
A low-flying helicopter towing a geophysical device collects scientific data on groundwater and geology. Information collected during these surveys can help with studying critical mineral resources, natural hazards and groundwater potential.

GPS time series from station HUSB, 2001-2022
Time series showing daily vertical GPS positions from the continuous GPS station HUSB between 2001 and 2022.
Time series showing daily vertical GPS positions from the continuous GPS station HUSB between 2001 and 2022.

Deformation and seismicity near South Sister during 2001-2022
Deformation and seismicity near South Sister during 2001-2022Comparison of vertical GPS motion measured at station HUSB (top) with earthquake depth (bottom). Red line is a 60-day average of the cleaned GPS time series plotted in gray. Earthquakes are plotted with respect to their magnitudes. The swarm in 2004 represents the vast majority of earthquake in the vicinity of the deforming region.
Deformation and seismicity near South Sister during 2001-2022
Deformation and seismicity near South Sister during 2001-2022Comparison of vertical GPS motion measured at station HUSB (top) with earthquake depth (bottom). Red line is a 60-day average of the cleaned GPS time series plotted in gray. Earthquakes are plotted with respect to their magnitudes. The swarm in 2004 represents the vast majority of earthquake in the vicinity of the deforming region.

Interferogram spanning 2020-2021 and showing uplift west of South Sister
Interferogram spanning 2020-2021 and showing uplift west of South SisterSatellite radar interferogram spanning June 19, 2020, to August 13, 2021, and showing the ground motion in the direction of the satellite.
Interferogram spanning 2020-2021 and showing uplift west of South Sister
Interferogram spanning 2020-2021 and showing uplift west of South SisterSatellite radar interferogram spanning June 19, 2020, to August 13, 2021, and showing the ground motion in the direction of the satellite.

Wildfire burn site located in Oregon
This is a landscape photo of a wildfire burn site located in Oregon, USA. Photo taken in November of 2021.
This is a landscape photo of a wildfire burn site located in Oregon, USA. Photo taken in November of 2021.

Photographs and a radiograph from a deceased Northern sea otter
Photographs and a radiograph from a deceased Northern sea otterPhotographs and a radiograph from a Northern sea otter (Enhydra lutris kenyoni) from Oregon, U.S.A. (A) The deceased sea otter on a beach in Oregon, U.S.A.
Photographs and a radiograph from a deceased Northern sea otter
Photographs and a radiograph from a deceased Northern sea otterPhotographs and a radiograph from a Northern sea otter (Enhydra lutris kenyoni) from Oregon, U.S.A. (A) The deceased sea otter on a beach in Oregon, U.S.A.

Barred owl sightings at Oregon Coast Range monitoring sites, 2015
Barred owl sightings at Oregon Coast Range monitoring sites, 2015Locations of barred owl sightings recorded during 2015 owl monitoring activities. Barred owls were lethally removed from the areas highlighted in pink. Supporting data is found at https://doi.org/10.3133/ofr20201089.
Barred owl sightings at Oregon Coast Range monitoring sites, 2015
Barred owl sightings at Oregon Coast Range monitoring sites, 2015Locations of barred owl sightings recorded during 2015 owl monitoring activities. Barred owls were lethally removed from the areas highlighted in pink. Supporting data is found at https://doi.org/10.3133/ofr20201089.

Barred owl movement west
Barred owls spread west during the 1900s and today completely overlap the range of the northern spotted owl.
Barred owls spread west during the 1900s and today completely overlap the range of the northern spotted owl.

Barred owl sightings at Oregon Coast Range monitoring sites, 2020
Barred owl sightings at Oregon Coast Range monitoring sites, 2020Locations of barred owl sightings recorded during 2020 owl monitoring activities. Barred owls were lethally removed from the areas highlighted in pink. Supporting data is found at https://doi.org/10.3133/ofr20201089.
Barred owl sightings at Oregon Coast Range monitoring sites, 2020
Barred owl sightings at Oregon Coast Range monitoring sites, 2020Locations of barred owl sightings recorded during 2020 owl monitoring activities. Barred owls were lethally removed from the areas highlighted in pink. Supporting data is found at https://doi.org/10.3133/ofr20201089.

Cascadia margin bathymetry
Bathymetry data from various sources, including newly released 2018 and 2019 multibeam data collected by the National Oceanic and Atmospheric Administration (NOAA) and the U.S. Geological Survey (USGS), were combined to create a composite 30-m resolution multibeam bathymetry surface of the southern Cascadia Margin offshore of Oregon and northern California.
Bathymetry data from various sources, including newly released 2018 and 2019 multibeam data collected by the National Oceanic and Atmospheric Administration (NOAA) and the U.S. Geological Survey (USGS), were combined to create a composite 30-m resolution multibeam bathymetry surface of the southern Cascadia Margin offshore of Oregon and northern California.