Mangrove deforestation and CO2 emissions in Indonesia
Mangrove deforestation and CO2 emissions in Indonesia

Official websites use .gov
A .gov website belongs to an official government organization in the United States.
Secure .gov websites use HTTPS
A lock () or https:// means you’ve safely connected to the .gov website. Share sensitive information only on official, secure websites.
Peruse our selection of remote sensing and Earth science imagery below.


Landsat image of Window Rock, Arizona, acquired on November 3, 2021.
For more information about Landsat, please visit www.usgs.gov/Landsat
To download the data, visit earthexplorer.usgs.gov
Landsat image of Window Rock, Arizona, acquired on November 3, 2021.
For more information about Landsat, please visit www.usgs.gov/Landsat
To download the data, visit earthexplorer.usgs.gov

Landsat 5 images of Zhuozhou, China, on September 7, 1999, showing top-of-atmosphere (TOA) reflectance; Level-2 surface reflectance (SR); and Level-2 surface temperature (ST), in Kelvin (K). View fact sheet at Landsat Collection 2 Level-2 Science Products (usgs.gov).
Landsat 5 images of Zhuozhou, China, on September 7, 1999, showing top-of-atmosphere (TOA) reflectance; Level-2 surface reflectance (SR); and Level-2 surface temperature (ST), in Kelvin (K). View fact sheet at Landsat Collection 2 Level-2 Science Products (usgs.gov).

Sediments swirl in Lake Erie and Lake St. Clair in this Landsat 9 image of both Detroit, Michigan, and Windsor, Ontario, from Oct. 31, 2021. The Great Lakes serve as sources of freshwater, recreational activity, transport, and habitat for the upper-midwestern US, and water quality remains a high priority.
Sediments swirl in Lake Erie and Lake St. Clair in this Landsat 9 image of both Detroit, Michigan, and Windsor, Ontario, from Oct. 31, 2021. The Great Lakes serve as sources of freshwater, recreational activity, transport, and habitat for the upper-midwestern US, and water quality remains a high priority.

The city of Kathmandu, Nepal, seen at the bottom left of this Landsat 9 image, lies in a valley south of the Himalayan Mountainsbetween Nepal and China. Glaciers, and the lakes formed by glacial meltwater, are visible in the top middle of this image.
The city of Kathmandu, Nepal, seen at the bottom left of this Landsat 9 image, lies in a valley south of the Himalayan Mountainsbetween Nepal and China. Glaciers, and the lakes formed by glacial meltwater, are visible in the top middle of this image.

In the Western U.S., in places like the Navajo Nation as seen in this Landsat 9 image, Landsat and other satellite data help people monitor drought conditions and manage irrigation water. With only 85 rain gauges to cover more than 27,000 square miles, satellite data and climate models are filling the gaps to help the Navajo Nation monitor drought severity.
In the Western U.S., in places like the Navajo Nation as seen in this Landsat 9 image, Landsat and other satellite data help people monitor drought conditions and manage irrigation water. With only 85 rain gauges to cover more than 27,000 square miles, satellite data and climate models are filling the gaps to help the Navajo Nation monitor drought severity.
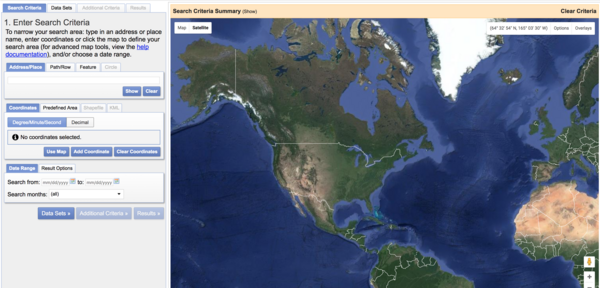
The EarthExplorer (EE) user interface is an online search, discovery, and ordering tool developed by the United States Geological Survey (USGS). EE supports the searching of satellite, aircraft, and other remote sensing inventories through interactive and textual-based query capabilities.
The EarthExplorer (EE) user interface is an online search, discovery, and ordering tool developed by the United States Geological Survey (USGS). EE supports the searching of satellite, aircraft, and other remote sensing inventories through interactive and textual-based query capabilities.

The Caldor Fire in California started on August 14, 2021 and quickly spread in high winds. The fire expanded toward the Lake Tahoe area as residents evacuated. Landsat image was captured on August 21, the 8th day. Landsat 8's near-infrared and shortwave infrared bands reveal active fire, burn scars, and smoke.
The Caldor Fire in California started on August 14, 2021 and quickly spread in high winds. The fire expanded toward the Lake Tahoe area as residents evacuated. Landsat image was captured on August 21, the 8th day. Landsat 8's near-infrared and shortwave infrared bands reveal active fire, burn scars, and smoke.

From top, Dr. Kyle Rodman, Dr. Zhiliang Zhu, and Dr. Sarah Hart, pictured with the graphic for the USGS EROS podcast "Eyes on Earth."
From top, Dr. Kyle Rodman, Dr. Zhiliang Zhu, and Dr. Sarah Hart, pictured with the graphic for the USGS EROS podcast "Eyes on Earth."

Example of the Landsat Collection 2 Burned Area Science Product showing the Bootleg Fire in Oregon on July 11, 2021 for tile h006V010. Left: Landsat 8 Collection 2 U.S. Analysis Ready Data Surface Reflectance image (Bands 6,5,4), Middle: Burn Classification (BC), and Right: Burn Probability (BP).
Example of the Landsat Collection 2 Burned Area Science Product showing the Bootleg Fire in Oregon on July 11, 2021 for tile h006V010. Left: Landsat 8 Collection 2 U.S. Analysis Ready Data Surface Reflectance image (Bands 6,5,4), Middle: Burn Classification (BC), and Right: Burn Probability (BP).

The Primary Land Cover (LCPRI) product over Hawaii for product year 2020. LCPRI shows the most likely thematic, classified land cover class on July 1 of the current year.
The Primary Land Cover (LCPRI) product over Hawaii for product year 2020. LCPRI shows the most likely thematic, classified land cover class on July 1 of the current year.
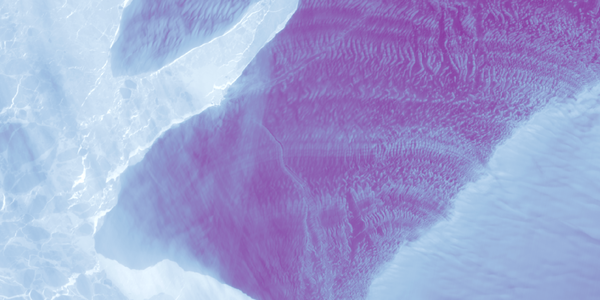
East Antarctica's Brunt Ice Shelf (large purplish area) is shown in this Landsat 8 thermal image along with Iceberg A-74 (top left purple area) on April 4, 2021, a little over a month after the iceberg broke off from the northern side of the ice shelf.
East Antarctica's Brunt Ice Shelf (large purplish area) is shown in this Landsat 8 thermal image along with Iceberg A-74 (top left purple area) on April 4, 2021, a little over a month after the iceberg broke off from the northern side of the ice shelf.

Landsat 8 Surface Reflectance image of the coast of Labrador and Newfoundland
Path 5 Row 23
Date acquired 20210216
Landsat 8 Surface Reflectance image of the coast of Labrador and Newfoundland
Path 5 Row 23
Date acquired 20210216

The state of Hawaii consists of eight main islands: Niihau, Kauai, Oahu, Molokai, Lanai, Kahoolawe, Maui, and Hawaii. From east to west, Hawaii is the widest state in the country.
Capital Honolulu
Image Source Landsat 8
Population 1,455,271
The state of Hawaii consists of eight main islands: Niihau, Kauai, Oahu, Molokai, Lanai, Kahoolawe, Maui, and Hawaii. From east to west, Hawaii is the widest state in the country.
Capital Honolulu
Image Source Landsat 8
Population 1,455,271
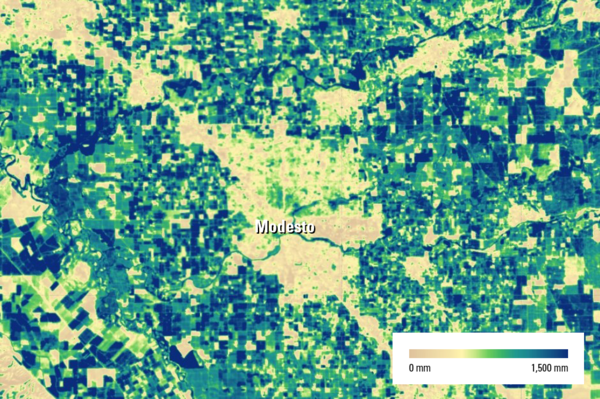
Map image of 2020 annual actual evapotranspiration (ETa) in the Modesto, California, area, as determined by the SSEBop ET model from the USGS Earth Resources Observation and Science (EROS) Center. Urban and other developed areas tend to have less evapotranspiration than fields and other vegetative areas.
Map image of 2020 annual actual evapotranspiration (ETa) in the Modesto, California, area, as determined by the SSEBop ET model from the USGS Earth Resources Observation and Science (EROS) Center. Urban and other developed areas tend to have less evapotranspiration than fields and other vegetative areas.

Several different ALI images grouped together.
Several different ALI images grouped together.

Featured Landsat Image: Qaidam Basin, China. Landsat 8 image from Path 139 Row 034 acquired on Date 22 October 2020. Shown as a pan-sharpened (Band 8) natural color image using the red, green and blue bands (Bands 4, 3, 2)
Featured Landsat Image: Qaidam Basin, China. Landsat 8 image from Path 139 Row 034 acquired on Date 22 October 2020. Shown as a pan-sharpened (Band 8) natural color image using the red, green and blue bands (Bands 4, 3, 2)

Landsat 8 image on the Utah-Arizona Border on the Navajo Nation acquired on September 18, 2020.
For more information about Landsat, please visit www.usgs.gov/Landsat
To download the data, visit earthexplorer.usgs.gov
Landsat 8 image on the Utah-Arizona Border on the Navajo Nation acquired on September 18, 2020.
For more information about Landsat, please visit www.usgs.gov/Landsat
To download the data, visit earthexplorer.usgs.gov

Example of the Landsat 7 ETM+ Collection 2 level-2 science products. Left: Landsat 7 level-2 surface reflectance image. Right: Landsat 7 level-2 surface temperature image. The data was acquired on August 19, 2020 (path 179 row 28).
Example of the Landsat 7 ETM+ Collection 2 level-2 science products. Left: Landsat 7 level-2 surface reflectance image. Right: Landsat 7 level-2 surface temperature image. The data was acquired on August 19, 2020 (path 179 row 28).

Example of the Landsat 8 OLI/TIRS Collection 2 level-1 product. This Landsat 8 image was acquired on August 18, 2020 over Lake Everard and Lake Harry in southern Australia and is shown as a false color composite using the shortwave infrared, near infrared, and red bands (bands 6,5,4).
Example of the Landsat 8 OLI/TIRS Collection 2 level-1 product. This Landsat 8 image was acquired on August 18, 2020 over Lake Everard and Lake Harry in southern Australia and is shown as a false color composite using the shortwave infrared, near infrared, and red bands (bands 6,5,4).
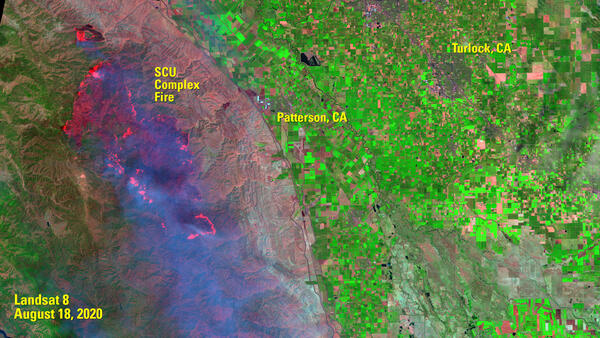
Landsat 8 image of 2020 SCU Complex Fire in California.
Landsat 8 image of 2020 SCU Complex Fire in California.