U.S. flag

An official website of the United States government

When we think of growth across the United States, we tend to think of medium or large cities with suburbs that expand into the surrounding area, such as cropland or forest or even desert. But growth happens in small towns, too—sometimes quite quickly for very specific reasons.

Media
A map of the borders of several states above a map of the border of Williams County, North Dakota, with Williston marked

Satellites can capture all this growth in a snapshot. The Annual National Land Cover Database (NLCD), based on Landsat satellite data, takes an even closer look at growth in a variety of ways that are useful to land and resource managers, city planners and businesses.

Developed land, as defined by the current Annual NLCD Collection 1.1, is land that has an impervious surface that doesn’t allow water through, such as concrete or asphalt, metal and all kinds of human-made structures. 

Many studies of developed land focus on large urban areas like Dallas, Texas. Here, we’re taking a look at developed land with a much smaller but equally important footprint. 

The Great Plains town of Williston, North Dakota, just north of the Missouri River in Williams County, provides a striking example of how Annual NLCD datasets can be used to study changes related to development in a rural setting. In the Williston area, an increasing population and energy development have left strong signatures on the landscape.

Annual NLCD statistics from the 2024 Land Cover dataset

  • The percentage of developed land cover across the continental United States is estimated at 6.75% of all land cover.
  • The amount of area classified as developed land cover in Dallas, Texas, is estimated at 3,954 km2.
  • The amount of area classified as developed land cover in Williston, North Dakota, is estimated at 46 km2.

Williston and Oil

Media
A map of Montana, North Dakota and South Dakota showing the Bakken Formation and Williston Basin

Williston sits very close to the center of the Williston Basin, which is a leading domestic oil- and gas-producing region. Williston also sits atop the Bakken Formation, a vast deposit of shale deep in the ground within the Williston Basin. 

Today, the Bakken Formation is among the largest oil fields in the United States (Brown, 2013). Williston’s Bakken oil refers to the oil extracted from the Bakken Formation.

Williston, founded in 1887, was a small town in Williams County where the economy was based on agriculture and did not change much between the 1980s and 2005 (Polzin, 2017). It was known for decades that the Bakken Formation contained oil, but it remained out of reach of existing oil extraction techniques. 

In 2005, the United States was dependent on oil imports as domestic oil production was under 50% of U.S. petroleum consumption (Rapier, 2017). In 2007, Congress passed an initiative to move the United States toward greater energy independence, kickstarting the oil boom in western North Dakota (U.S. Congress, 2007). 

Media
A bar chart with a fever line and numbers on both sides plus the bottom

The population in Williston doubled between 2010 and 2020. During that decade, there were highs and lows in the price of oil, which led directly to booms and busts in the oil fields. Oil is priced in the global market, and every time the price of oil drops, so does production, leading to reduced employment. As oil prices rise, new technologies are forged to reach places like the Bakken shale. With each bump up in the price of oil, there is a comparable bump in production as well as Williston population. The effect of world events such as the oil price wars with OPEC in 2014-2016 and the COVID-19 pandemic in 2020 rippled through Williston, affecting the production of oil and the population. 

The technology of hydraulic fracturing (fracking), combined with horizontal drilling, enabled the extraction of significant quantities of high-quality crude oil from the vast deep shale deposits in the Bakken. The “shale revolution” stimulated tremendous production and high oil prices (Brown, 2013). By 2008, drilling of new wells in North Dakota surged like never before. Oil production increased dramatically, and Williston’s Bakken oil became a significant factor in domestic energy production. By 2011-2012, the U.S. price of oil slightly topped the global price. This increase in domestic oil production helped to keep a lid on global oil prices (Rapier, 2025).

Showing Change over 40 Years

Media
A map showing, with varying colors, the increasing development in and around Williston, North Dakota, over 40 years

In the above image of Williston, the colors represent the range of years that a particular area was developed. The dark gray area in the lower center of the image is the area of the city that developed prior to 1985. Throughout the 1980s and 1990s, roads were built, and small parcels were developed on the periphery of town. 

Starting in 2000, there was an increase in the rate of development as Williston expanded east and west along the river. The Eagle Ridge Golf Course, northeast of town, expanded in 2005. By 2010, development began expanding north. In 2011, a boomtown atmosphere existed in Williston (Polzin, 2017). Another highway was built on the west side in 2014 to better connect the industrial centers west of town with the north end of town. In 2018, the airport moved to a location northwest of town.    

Media
Three animations showing a city's change over 40 years, side by side with a title above

The above animations, including Land Cover, Landsat and Fractional Impervious Surface, show the changes on the ground over time between 1985 and 2024. 

  • Annual NLCD Land Cover allows you to see what kind of land cover changes are happening and when the change occurred. Agricultural land is brown, grassland is tan, pasture is yellow, and developed land is pink and red. Blue is the Missouri River and its floodplain to the south and the Little Muddy River running into the Missouri River on the east side of Williston. Over time, you can see agricultural land and grassland being replaced by developed land (Fitzgerald et al., 2020; Preston et al., 2016; Torgerson, 2017).
  • Landsat offers a true color look at the changes going on across the landscape, with development shown in pale colors.
  • The Annual NLCD Fractional Impervious Surface shows the increase in developed land cover (pink and red) with an expanding road network, more buildings and oil well pads. 

Another Annual NLCD View

Media
An animation on a black background with yellows and blues

Above is an animation of the Annual NLCD Impervious Descriptor product showing annual changes in roads and other impervious surfaces for Williams County, with the town of Williston in the south. The descriptor layer categorizes roads (blue) and other development (yellow). Across the county, the progression of new structures and well sites can be seen over time, extending east and west along the roads. Activity especially picks up in the mid-2000s.

This layer allows Annual NLCD users extra flexibility to manipulate and categorize the impervious surface by isolating the roads so other changes can be highlighted. This ultimately gives them the ability to more accurately identify the type of development occurring each year. 

In early 2008, there were fewer than 500 wells in the North Dakota portion of the Bakken Formation. By the end of the year, there were more than 850. Today, there are greater than 17,000 well sites (ND Dept. of Mineral Resources, 2025).  

Background photo: An aerial view near Williston, North Dakota, including an oil well pad (lower right). USGS photo by Seth Haines.


References:

Brown, S.P.A. and Yücel, M. K., 2013, The Shale Gas and Tight Oil Boom: U.S. States’ Economic Gains and Vulnerabilities, Council on Foreign Relations, 58 E. 68th St., New York, NY, October 2013. 

Department of Mineral Resources, North Dakota (NDOGD), 2025, Historical monthly Bakken oil production statistics; accessed online September 22, 2025, at https://www.dmr.nd.gov/oilgas/stats/statisticsvw.asp.

Fitzgerald, T., Y. Kuwayama, S. Olmstead, and A. Thompson, 2020, Dynamic impacts of U.S. energy development on agricultural land use, Energy Policy, v.137, 111163.

Rapier, R., 2017, How the shale boom turned the world upside down, Forbes, April 21, 2017.

Rapier, R., 2025, U.S. Oil Production Is on Pace for a New Record, But Growth Is Slowing, Forbes, September 18, 2025.

Polzin, P., 2017, The economic impact of the Bakken, Montana Business Quarterly, January 9, 2017.

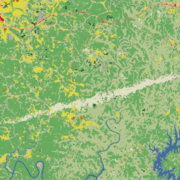
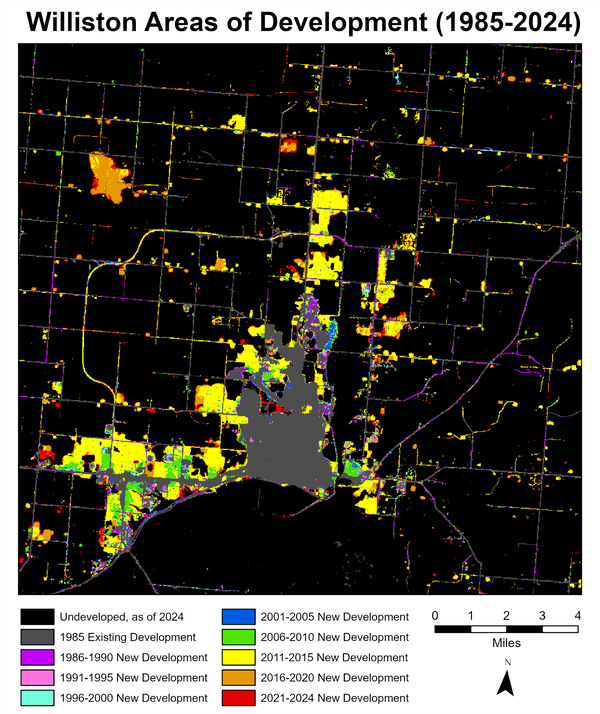
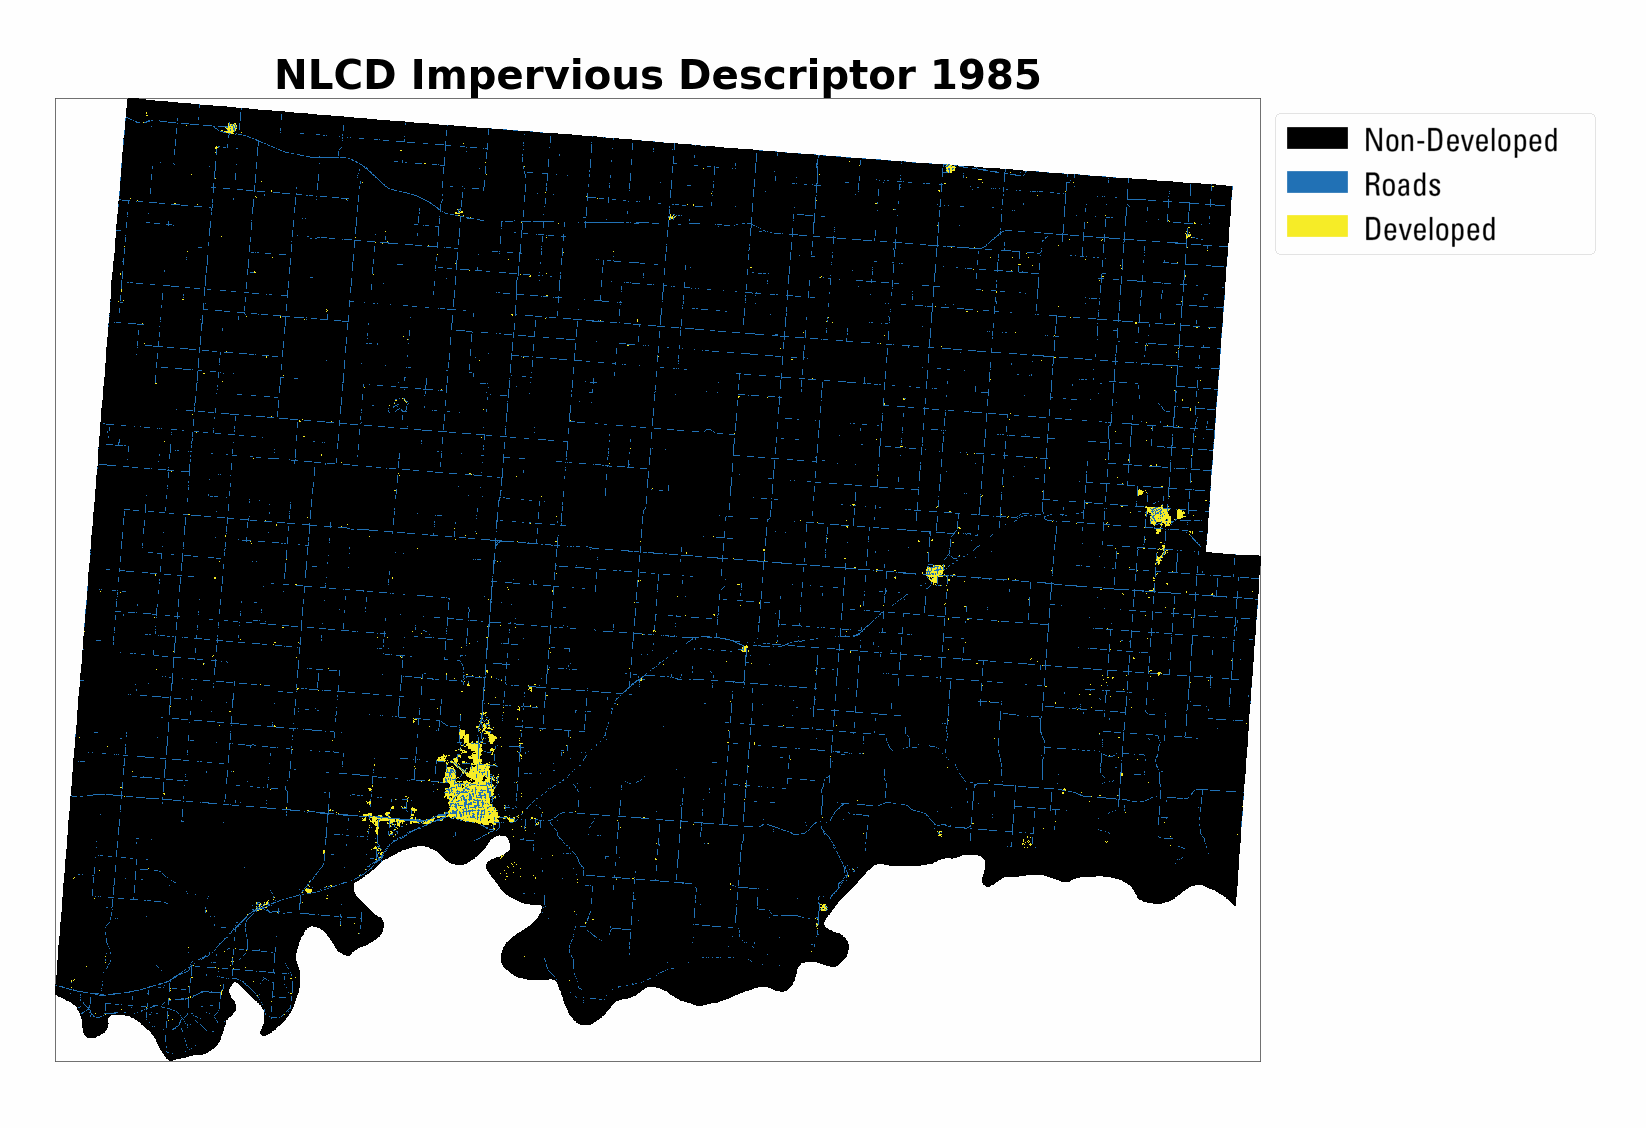
Preston, T.M. and K. Kim, Land cover changes associated with recent energy development in the Williston Basin; Northern Great Plains, USA, Science of the Total Environment, 2016, 566-567: p. 1511–1518.

Torgerson, Eric, 2017, Oil extraction infrastructure development and resulting land-cover change in Mckenzie County, North Dakota, 2009 To 2014, Theses and Dissertations, 2151. https://commons.und.edu/theses/2151

US Library of Congress, 2007, H.R.6 - Energy Independence and Security Act of 2007, accessed online September 22, 2025, at https://www.congress.gov/bill/110th-congress/house-bill/6/titles.
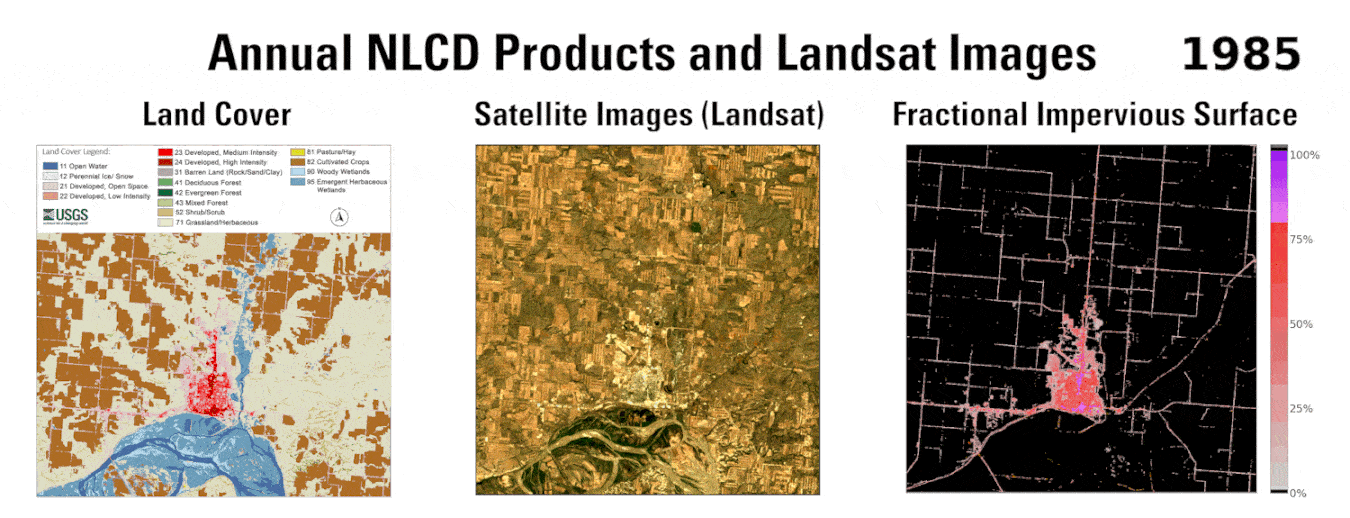
Was this page helpful?