




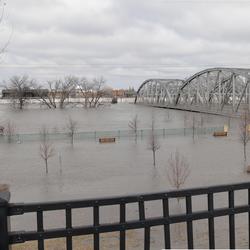
Flooding in Soldier Pond, Maine, following rainfall and snowmelt that led to high water levels in the Fish and St. John Rivers in April and May of 2018.
The USGS delivers continuous streamflow, stage (water-level), and tide data to help emergency managers and other decision makers protect life and property caused by floods and other water-related hazards.
December 2023 Flooding in Maine
December 2023 Flooding in Maine

USGS captures critical data during recent flood in Maine.
Media

Sources/Usage: Public Domain. View Media Details
The USGS New England Water Science Center maintains 434 streamgages that collect data to determine the amount of water flowing in rivers and streams in Connecticut, Maine, Massachusetts, New Hampshire, Rhode Island, and Vermont. The Water Science Center also maintains 13 tide along the coast of New England.
Nationwide, the USGS operates and maintains about 8,000 streamgages, which deliver near real-time data to the public.
Automatic alerts can be sent to mobile devices when streamflow of river or tide stage (water levels) reach user defined thresholds, such as a National Weather Service defined flood stage. These alerts help emergency managers and the public assess potentially hazardous conditions nearby a streamgage, stage-only gage, or tide gage.
USGS WaterAlert automatically sends email or SMS text messages when certain parameters at a USGS real-time data-collection station, exceed user-defined thresholds.
USGS Flood Information provides additional information about USGS flood science.
Media

Sources/Usage: Some content may have restrictions. View Media Details
Current Flood Data for New England
- National Water Dashboard for New England
- WaterWatch Map of flood and high flow condition (select a State or Water-Resources Region)
- WaterWatch Map of flood and high flow conditions – New England
- USGS Project Alerts – Flood and Drought
- USGS Flood-Event Viewer (Data for Selected Current and Historic Floods – Coastal and Riverine)
- USGS Flood Inundation Mapper
- USGS Operational Total Water Level and Coastal Change Viewer
Media

Sources/Usage: Public Domain. View Media Details
Flood Frequency Information
Visit USGS Floods and Recurrence Intervals for more information about floods and the annual exceedance probability (AEP).
New England Flood Frequency Studies
Media

Sources/Usage: Public Domain. View Media Details
Flood Resources from Partner Agencies
Federal Emergency Management Agency (FEMA)
National Weather Service (NWS)
- NWS Northeast River Forecast Center
- NWS Current Precipitation Radar
- NWS Future Quantitative Precipitation Forecasts (1-7 day totals)
- NOAA Office of Water Prediction – National Water Model
Northeast River Forecast Center (NERFC)
- NERFC Daily Hydrometeorological Briefing
- Recent NERFC Observed Precipitation Maps
- NERFC 5-Day Significant River Flood Outlook
- NERFC Future Quantitative Precipitation Forecast (72 Hours)
State Emergency Management
U.S. Army Corps of Engineers
- U.S. Army Corps of Engineers – New England Reservoir Control Center
- U.S. Army Corps of Engineers Silver Jackets Program
Safety Related Resources
Below are resources associated with flood information.

USGS Flood Information
The USGS collects real-time flood data and conducts flood science to help keep communities safe before, during, and after a flood.
Filter Total Items: 17

Northeast Region Flood Science Capability Team
Learn about the Northeast Region Flood Science Capability Team.
Flood Inundation Mapping (FIM) Program
The USGS Flood Inundation Mapping (FIM) Program helps communities protect lives and property by providing tools and information to help them understand their local flood risks and make cost-effective mitigation decisions.

Estimating Nitrogen Loading from Groundwater and Potential Effects of Sea-Level Rise in Rhode Island's Salt Ponds Region
The U.S. Geological Survey (USGS), in cooperation with the Southeast New England Program of the U.S. Environmental Protection Agency, is estimating the magnitude, spatial distribution, and travel times of nitrogen-loading to ponds and streams in the Salt Ponds region of southern Rhode Island. This information can be used to guide conservation-management efforts aimed at reducing nitrogen inputs to...

December 2023 Flood in Maine
The U.S. Geological Survey (USGS) New England Water Science Center, in cooperation with the Federal Emergency Management Agency (FEMA), is conducting a study to characterize the magnitude and extent of the December 18-21, 2023 Flood in various portions of the State of Maine.

July 2023 Flood in Vermont
From July 9 through July 12, 2023, 3 to 9 inches of rain fell within 48 hours across the state of Vermont, causing catastrophic flooding and millions of dollars in damage. The high amount of rain caused several rivers to peak at record levels, in some cases exceeding records set during Tropical Storm Irene in 2011.

Erosion Potential and Flood Vulnerability of Streams and Stream Crossings at Acadia National Park, Maine
The U.S. Geological Survey (USGS) New England Water Science Center, in cooperation with Acadia National Park, is assessing the erosion potential and flood vulnerability of the park’s streams, culverts, and bridges to inform management decisions on infrastructure upgrades.

A Statewide Hydraulic Modeling Tool for Stream Crossing Projects in Massachusetts
The U.S. Geological Survey (USGS), in cooperation with the Massachusetts Department of Environmental Protection (MassDEP), and collaboration with the University of Massachusetts at Amherst (UMass Amherst) began a series of studies in 2019 to develop a GIS-based hydraulic modeling tool and to provide preliminary culvert designs for stream-crossing replacement projects in Massachusetts on USGS...

New England Lidar-Derived Hydrography Project
High-quality light detection and ranging (lidar) data from USGS 3D Elevation Program (3DEP) has unlocked the potential to derive new and innovative hydrography datasets such as the USGS next generation 3D Hydrography Program (3DHP) that can be used for many hydrologic and hydraulic (H&H) modeling applications. Federal Emergency Management Agency (FEMA) mapping partners require elevation and...

Satellite-based Remote Sensing of River Discharge
The U.S. Geological Survey and NASA are collaborating on a study to develop methods to estimate river flows from satellite observations.

Flood Documentation and Inundation Mapping of the January and March 2018 Nor’easters in Coastal Massachusetts
2018 Nor’easters in Coastal Massachusetts

Remembering Tropical Storm Irene in New England
On August 28, 2011 Tropical Storm Irene made landfall in New England, leading to coastal storm surge, significant riverine flooding, sediment transport to Long Island Sound, and major infrastructure damage and destruction. Ten years later, the USGS New England Water Science Center looks back at Irene, the data collected by our Center during the event, the response by our employees before, during...

Rapid Deployment Gages (RDGs)
Rapid Deployment Gages (RDGs) are fully-functional streamgages designed to be deployed quickly and temporarily to measure and transmit stream stage data in emergency situations.
Below are multimedia items associated with flood information.
Filter Total Items: 53

Flooding in Soldier Pond, Maine
Flooding in Soldier Pond, Maine, following rainfall and snowmelt that led to high water levels in the Fish and St. John Rivers in April and May of 2018.

Flooded Road near USGS gaging station 01055500 in Turner, Maine
Flooded Road near USGS gaging station 01055500 in Turner, MaineStop sign at the end of School House Hill Rd in Turner, Maine near USGS gaging station 01055500 on the Nezinscot River.
Flooded Road near USGS gaging station 01055500 in Turner, Maine
Flooded Road near USGS gaging station 01055500 in Turner, MaineStop sign at the end of School House Hill Rd in Turner, Maine near USGS gaging station 01055500 on the Nezinscot River.

Flooding around Mill River streamflow gage 01171500 at Northampton, MA
Flooding around Mill River streamflow gage 01171500 at Northampton, MAFlooding around Mill River USGS streamflow gage 01171500 at Northampton, Massachusetts.
Flooding around Mill River streamflow gage 01171500 at Northampton, MA
Flooding around Mill River streamflow gage 01171500 at Northampton, MAFlooding around Mill River USGS streamflow gage 01171500 at Northampton, Massachusetts.

Rising River
On April 9, 2014 a visit to the USGS gaging station on Libby Brook near Northfield, Maine showed that while runoff had caused a large rise in the small brook, there still remained a significant snowpack in the area.
On April 9, 2014 a visit to the USGS gaging station on Libby Brook near Northfield, Maine showed that while runoff had caused a large rise in the small brook, there still remained a significant snowpack in the area.

Flood damage from tropical storm Irene
Flood damage from tropical storm Irene, August 28, 2011, washed out Maxam Road bridge on the West Branch North River in Colrain, Massachusetts.
Flood damage from tropical storm Irene, August 28, 2011, washed out Maxam Road bridge on the West Branch North River in Colrain, Massachusetts.

Covered bridge damaged by tropical storm Irene
Flood damage to Eunice Williams Road in Greenfield, MA on the Green River from tropical storm Irene on August, 28, 2011.
Flood damage to Eunice Williams Road in Greenfield, MA on the Green River from tropical storm Irene on August, 28, 2011.

Flooded Streamgage
Flooding at the USGS Streamgage Nashua River at Pepperell, MA (01096500) on March 17, 2010 at about 12:15 EDT at a gage height of 14.58 ft and discharge of 9,780 cfs.
Flooding at the USGS Streamgage Nashua River at Pepperell, MA (01096500) on March 17, 2010 at about 12:15 EDT at a gage height of 14.58 ft and discharge of 9,780 cfs.

Flooding on the Kennebunk River
The USGS has been monitoring the Kennebunk River near Kennebunk, Maine since June 2008 and the peak discharge for the period of record occurred in February 2010.
The USGS has been monitoring the Kennebunk River near Kennebunk, Maine since June 2008 and the peak discharge for the period of record occurred in February 2010.

St. John River at Ft. Kent, Maine Flood 2008
Understanding the forces that influence major floods can help inform the design of more resilient infrastructure. Image shows a major flood on the St. John River on the border of Maine, United States and New Brunswick, Canada, April 29, 2008. This site was part of the study. USGS Public Domain.
Understanding the forces that influence major floods can help inform the design of more resilient infrastructure. Image shows a major flood on the St. John River on the border of Maine, United States and New Brunswick, Canada, April 29, 2008. This site was part of the study. USGS Public Domain.

Snow Falls - Maine
As the Little Androscoggin River flows through western Maine it eventually reaches Snow Falls, a 25 ft cascading waterfall in the town of West Paris.
As the Little Androscoggin River flows through western Maine it eventually reaches Snow Falls, a 25 ft cascading waterfall in the town of West Paris.

Connecticut River, Holyoke Dam during flood of March 1936
Connecticut River, Holyoke Dam during flood of March 1936Connecticut River Holyoke Dam, Holyoke Water Power Company, during flood of March 1936.
Connecticut River, Holyoke Dam during flood of March 1936
Connecticut River, Holyoke Dam during flood of March 1936Connecticut River Holyoke Dam, Holyoke Water Power Company, during flood of March 1936.
Below are FAQ associated with flood information.

Where can I find flood maps? Where can I find flood maps?
FEMA is the official public source for flood maps for insurance purposes: FEMA’s Flood Map Service Center FEMA’s National Flood Hazard Layer NOAA is responsible for producing flood forecast maps that combine precipitation data with USGS streamflow data: NWS - National Water Prediction Service: River forecasts and long range flood outlook Coastal Inundation Dashboard: Real-time and historical...
The USGS delivers continuous streamflow, stage (water-level), and tide data to help emergency managers and other decision makers protect life and property caused by floods and other water-related hazards.
December 2023 Flooding in Maine
December 2023 Flooding in Maine
USGS captures critical data during recent flood in Maine.
Media
Sources/Usage: Public Domain. View Media Details
The USGS New England Water Science Center maintains 434 streamgages that collect data to determine the amount of water flowing in rivers and streams in Connecticut, Maine, Massachusetts, New Hampshire, Rhode Island, and Vermont. The Water Science Center also maintains 13 tide along the coast of New England.
Nationwide, the USGS operates and maintains about 8,000 streamgages, which deliver near real-time data to the public.
Automatic alerts can be sent to mobile devices when streamflow of river or tide stage (water levels) reach user defined thresholds, such as a National Weather Service defined flood stage. These alerts help emergency managers and the public assess potentially hazardous conditions nearby a streamgage, stage-only gage, or tide gage.
USGS WaterAlert automatically sends email or SMS text messages when certain parameters at a USGS real-time data-collection station, exceed user-defined thresholds.
USGS Flood Information provides additional information about USGS flood science.
Media
Sources/Usage: Some content may have restrictions. View Media Details
Current Flood Data for New England
- National Water Dashboard for New England
- WaterWatch Map of flood and high flow condition (select a State or Water-Resources Region)
- WaterWatch Map of flood and high flow conditions – New England
- USGS Project Alerts – Flood and Drought
- USGS Flood-Event Viewer (Data for Selected Current and Historic Floods – Coastal and Riverine)
- USGS Flood Inundation Mapper
- USGS Operational Total Water Level and Coastal Change Viewer
Media
Sources/Usage: Public Domain. View Media Details
Flood Frequency Information
Visit USGS Floods and Recurrence Intervals for more information about floods and the annual exceedance probability (AEP).
New England Flood Frequency Studies
Media
Sources/Usage: Public Domain. View Media Details
Flood Resources from Partner Agencies
Federal Emergency Management Agency (FEMA)
National Weather Service (NWS)
- NWS Northeast River Forecast Center
- NWS Current Precipitation Radar
- NWS Future Quantitative Precipitation Forecasts (1-7 day totals)
- NOAA Office of Water Prediction – National Water Model
Northeast River Forecast Center (NERFC)
- NERFC Daily Hydrometeorological Briefing
- Recent NERFC Observed Precipitation Maps
- NERFC 5-Day Significant River Flood Outlook
- NERFC Future Quantitative Precipitation Forecast (72 Hours)
State Emergency Management
U.S. Army Corps of Engineers
- U.S. Army Corps of Engineers – New England Reservoir Control Center
- U.S. Army Corps of Engineers Silver Jackets Program
Safety Related Resources
Below are resources associated with flood information.
USGS Flood Information
The USGS collects real-time flood data and conducts flood science to help keep communities safe before, during, and after a flood.
Filter Total Items: 17
Northeast Region Flood Science Capability Team
Learn about the Northeast Region Flood Science Capability Team.
Flood Inundation Mapping (FIM) Program
The USGS Flood Inundation Mapping (FIM) Program helps communities protect lives and property by providing tools and information to help them understand their local flood risks and make cost-effective mitigation decisions.
Estimating Nitrogen Loading from Groundwater and Potential Effects of Sea-Level Rise in Rhode Island's Salt Ponds Region
The U.S. Geological Survey (USGS), in cooperation with the Southeast New England Program of the U.S. Environmental Protection Agency, is estimating the magnitude, spatial distribution, and travel times of nitrogen-loading to ponds and streams in the Salt Ponds region of southern Rhode Island. This information can be used to guide conservation-management efforts aimed at reducing nitrogen inputs to...
December 2023 Flood in Maine
The U.S. Geological Survey (USGS) New England Water Science Center, in cooperation with the Federal Emergency Management Agency (FEMA), is conducting a study to characterize the magnitude and extent of the December 18-21, 2023 Flood in various portions of the State of Maine.
July 2023 Flood in Vermont
From July 9 through July 12, 2023, 3 to 9 inches of rain fell within 48 hours across the state of Vermont, causing catastrophic flooding and millions of dollars in damage. The high amount of rain caused several rivers to peak at record levels, in some cases exceeding records set during Tropical Storm Irene in 2011.
Erosion Potential and Flood Vulnerability of Streams and Stream Crossings at Acadia National Park, Maine
The U.S. Geological Survey (USGS) New England Water Science Center, in cooperation with Acadia National Park, is assessing the erosion potential and flood vulnerability of the park’s streams, culverts, and bridges to inform management decisions on infrastructure upgrades.
A Statewide Hydraulic Modeling Tool for Stream Crossing Projects in Massachusetts
The U.S. Geological Survey (USGS), in cooperation with the Massachusetts Department of Environmental Protection (MassDEP), and collaboration with the University of Massachusetts at Amherst (UMass Amherst) began a series of studies in 2019 to develop a GIS-based hydraulic modeling tool and to provide preliminary culvert designs for stream-crossing replacement projects in Massachusetts on USGS...
New England Lidar-Derived Hydrography Project
High-quality light detection and ranging (lidar) data from USGS 3D Elevation Program (3DEP) has unlocked the potential to derive new and innovative hydrography datasets such as the USGS next generation 3D Hydrography Program (3DHP) that can be used for many hydrologic and hydraulic (H&H) modeling applications. Federal Emergency Management Agency (FEMA) mapping partners require elevation and...
Satellite-based Remote Sensing of River Discharge
The U.S. Geological Survey and NASA are collaborating on a study to develop methods to estimate river flows from satellite observations.
Flood Documentation and Inundation Mapping of the January and March 2018 Nor’easters in Coastal Massachusetts
2018 Nor’easters in Coastal Massachusetts
Remembering Tropical Storm Irene in New England
On August 28, 2011 Tropical Storm Irene made landfall in New England, leading to coastal storm surge, significant riverine flooding, sediment transport to Long Island Sound, and major infrastructure damage and destruction. Ten years later, the USGS New England Water Science Center looks back at Irene, the data collected by our Center during the event, the response by our employees before, during...
Rapid Deployment Gages (RDGs)
Rapid Deployment Gages (RDGs) are fully-functional streamgages designed to be deployed quickly and temporarily to measure and transmit stream stage data in emergency situations.
Below are multimedia items associated with flood information.
Filter Total Items: 53
Flooding in Soldier Pond, Maine
Flooding in Soldier Pond, Maine, following rainfall and snowmelt that led to high water levels in the Fish and St. John Rivers in April and May of 2018.
Flooding in Soldier Pond, Maine, following rainfall and snowmelt that led to high water levels in the Fish and St. John Rivers in April and May of 2018.
Flooded Road near USGS gaging station 01055500 in Turner, Maine
Flooded Road near USGS gaging station 01055500 in Turner, MaineStop sign at the end of School House Hill Rd in Turner, Maine near USGS gaging station 01055500 on the Nezinscot River.
Flooded Road near USGS gaging station 01055500 in Turner, Maine
Flooded Road near USGS gaging station 01055500 in Turner, MaineStop sign at the end of School House Hill Rd in Turner, Maine near USGS gaging station 01055500 on the Nezinscot River.
Flooding around Mill River streamflow gage 01171500 at Northampton, MA
Flooding around Mill River streamflow gage 01171500 at Northampton, MAFlooding around Mill River USGS streamflow gage 01171500 at Northampton, Massachusetts.
Flooding around Mill River streamflow gage 01171500 at Northampton, MA
Flooding around Mill River streamflow gage 01171500 at Northampton, MAFlooding around Mill River USGS streamflow gage 01171500 at Northampton, Massachusetts.
Rising River
On April 9, 2014 a visit to the USGS gaging station on Libby Brook near Northfield, Maine showed that while runoff had caused a large rise in the small brook, there still remained a significant snowpack in the area.
On April 9, 2014 a visit to the USGS gaging station on Libby Brook near Northfield, Maine showed that while runoff had caused a large rise in the small brook, there still remained a significant snowpack in the area.
Flood damage from tropical storm Irene
Flood damage from tropical storm Irene, August 28, 2011, washed out Maxam Road bridge on the West Branch North River in Colrain, Massachusetts.
Flood damage from tropical storm Irene, August 28, 2011, washed out Maxam Road bridge on the West Branch North River in Colrain, Massachusetts.
Covered bridge damaged by tropical storm Irene
Flood damage to Eunice Williams Road in Greenfield, MA on the Green River from tropical storm Irene on August, 28, 2011.
Flood damage to Eunice Williams Road in Greenfield, MA on the Green River from tropical storm Irene on August, 28, 2011.
Flooded Streamgage
Flooding at the USGS Streamgage Nashua River at Pepperell, MA (01096500) on March 17, 2010 at about 12:15 EDT at a gage height of 14.58 ft and discharge of 9,780 cfs.
Flooding at the USGS Streamgage Nashua River at Pepperell, MA (01096500) on March 17, 2010 at about 12:15 EDT at a gage height of 14.58 ft and discharge of 9,780 cfs.
Flooding on the Kennebunk River
The USGS has been monitoring the Kennebunk River near Kennebunk, Maine since June 2008 and the peak discharge for the period of record occurred in February 2010.
The USGS has been monitoring the Kennebunk River near Kennebunk, Maine since June 2008 and the peak discharge for the period of record occurred in February 2010.
St. John River at Ft. Kent, Maine Flood 2008
Understanding the forces that influence major floods can help inform the design of more resilient infrastructure. Image shows a major flood on the St. John River on the border of Maine, United States and New Brunswick, Canada, April 29, 2008. This site was part of the study. USGS Public Domain.
Understanding the forces that influence major floods can help inform the design of more resilient infrastructure. Image shows a major flood on the St. John River on the border of Maine, United States and New Brunswick, Canada, April 29, 2008. This site was part of the study. USGS Public Domain.
Snow Falls - Maine
As the Little Androscoggin River flows through western Maine it eventually reaches Snow Falls, a 25 ft cascading waterfall in the town of West Paris.
As the Little Androscoggin River flows through western Maine it eventually reaches Snow Falls, a 25 ft cascading waterfall in the town of West Paris.
Connecticut River, Holyoke Dam during flood of March 1936
Connecticut River, Holyoke Dam during flood of March 1936Connecticut River Holyoke Dam, Holyoke Water Power Company, during flood of March 1936.
Connecticut River, Holyoke Dam during flood of March 1936
Connecticut River, Holyoke Dam during flood of March 1936Connecticut River Holyoke Dam, Holyoke Water Power Company, during flood of March 1936.
Below are FAQ associated with flood information.
Where can I find flood maps? Where can I find flood maps?
FEMA is the official public source for flood maps for insurance purposes: FEMA’s Flood Map Service Center FEMA’s National Flood Hazard Layer NOAA is responsible for producing flood forecast maps that combine precipitation data with USGS streamflow data: NWS - National Water Prediction Service: River forecasts and long range flood outlook Coastal Inundation Dashboard: Real-time and historical...