The USGS collects flood data and conducts targeted flood science to help Federal, State, and local agencies, decision makers, and the public before, during, and after a flood. Our efforts provide situational awareness, drive predictive models, inform infrastructure design and operation, undergird floodplain mapping, assist flood constituent/load quantification, and facilitate flood impact assessments.
Use this website to discover real-time and historic flood data and scientific investigations, and learn how we collect data while addressing logistical and technical challenges.
USGS Flood Current Conditions and Notifications
The USGS offers multiple products that allow our stakeholders and the public to be notified of high-flow conditions and USGS flood response activities:
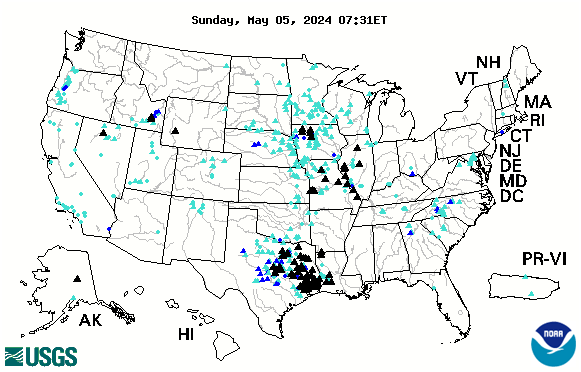
- WaterWatch: Access current flood and high-flow conditions (image below), along with other streamflow information
- Regional and Local Flood Alerts: View current and historical alerts of flooding and response activities; subscribe to RSS feeds
- WaterAlert: The WaterAlert service sends e-mail or text (SMS) messages to you when certain parameters (including streamflow and gage height/stage) exceed user-definable thresholds, as measured by a USGS real-time data-collection station. Use the WaterAlert map to create your custom notifications.
- WaterNow: When you email or text the WaterNow service with USGS gage or site number, WaterNow will reply with the most recent observation.

Other USGS Flood Resources
Flood Resources from our Partners
National Weather Service River Observations and Forecast
National Weather Service Riverwatch: Mississippi River Basin Forecasts
Below are other science projects associated with USGS flood information and activities.
Water Data Visualizations
Rapid Deployment Gages (RDGs)
StreamStats: Streamflow Statistics and Spatial Analysis Tools for Water-Resources Applications
Water Science School
Welcome to the U.S. Geological Survey's (USGS) Water Science School. We offer information on many aspects of water, along with pictures, data, maps, and an interactive center where you can give opinions and test your water knowledge.
Surge, Wave, and Tide Hydrodynamics (SWaTH) Network
USGS Flood Event Viewer: Providing Hurricane and Flood Response Data
Historical Flooding
Flood Inundation Mapping (FIM) Program
Below are data or web applications associated with USGS flood information and activities.
Below are publications associated with USGS flood information and activities.
Preliminary stage and streamflow data at selected U.S. Geological Survey streamgages in New England for the floods of April 2019
The combination of rainfall and snowmelt in northern New England and rainfall in southern New England resulted in minor to major flooding from April 15 to 24, 2019, according to stage and streamflow data collected at 63 selected U.S. Geological Survey (USGS) streamgages. A typical USGS streamgage measures and records stream stage and estimates streamflow based on a relation (rating curve) of discr
Identifying and preserving high-water mark data
100-Year flood–it's all about chance
Below are data or web applications associated with USGS flood information and activities.
WaterAlert
The U.S. Geological Survey WaterAlert service provides notifications to your email or phone for changes in water conditions based on thresholds you choose.
National Water Dashboard (NWD)
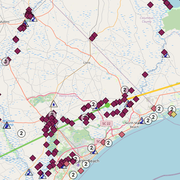
The National Water Dashboard (NWD) is a mobile, interactive tool that provides real-time information on water levels, weather, and flood forecasts - all in one place on a computer, smartphone, or other mobile device. The NWD presents real-time stream, lake and reservoir, precipitation, and groundwater data from more than 13,500 USGS observation stations across the country.
USGS Flood Event Viewer
During large, short-term events, the USGS collects streamflow and additional data (including storm tide, wave height, high-water marks, and additional sensor deployments) to aid in documenting flood events. The USGS Flood Event Viewer provides convenient, map-based access to downloadable event-based data.
StreamStats Application
StreamStats provides access to spatial analytical tools that are useful for water-resources planning and management, and for engineering and design purposes. The map-based user interface can be used to delineate drainage areas, get basin characteristics and estimates of flow statistics, and more. Available information varies from state to state.
Flood Inundation Mapper
USGS Flood Inundation Maps, along with Internet information regarding current stage from the USGS streamgage, provide emergency management personnel and residents with information that is critical for flood-response activities, such as evacuations and road closures, as well as for post-flood recovery efforts.
Below are software products associated with USGS flood information and activities.
National Streamflow Statistics (NSS) Application - Formerly NSS Program
The USGS develops regression equations for estimating streamflow statistics for every state, Puerto Rico, and a number of metropolitan areas in the U.S. These equations have been compiled into the National Streamflow Statistics (NSS) Application for design, planning, management, and regulatory purposes. These estimates are often needed at ungaged sites where no observed flow data are available.
- Overview
The USGS collects flood data and conducts targeted flood science to help Federal, State, and local agencies, decision makers, and the public before, during, and after a flood. Our efforts provide situational awareness, drive predictive models, inform infrastructure design and operation, undergird floodplain mapping, assist flood constituent/load quantification, and facilitate flood impact assessments.
Use this website to discover real-time and historic flood data and scientific investigations, and learn how we collect data while addressing logistical and technical challenges.
USGS Flood Current Conditions and Notifications
The USGS offers multiple products that allow our stakeholders and the public to be notified of high-flow conditions and USGS flood response activities:
- WaterWatch: Access current flood and high-flow conditions (image below), along with other streamflow information
- Regional and Local Flood Alerts: View current and historical alerts of flooding and response activities; subscribe to RSS feeds
- WaterAlert: The WaterAlert service sends e-mail or text (SMS) messages to you when certain parameters (including streamflow and gage height/stage) exceed user-definable thresholds, as measured by a USGS real-time data-collection station. Use the WaterAlert map to create your custom notifications.
- WaterNow: When you email or text the WaterNow service with USGS gage or site number, WaterNow will reply with the most recent observation.
Remote image UrlSources/Usage: Public Domain.Map of USGS streamgages currently experiencing flood and high-flow streamflow conditions. Image updated hourly by USGS WaterWatch. Other USGS Flood Resources
Flood Resources from our Partners
National Weather Service River Observations and Forecast
National Weather Service Riverwatch: Mississippi River Basin Forecasts
- Science
Below are other science projects associated with USGS flood information and activities.
Water Data Visualizations
Water data visualizations are provocative visuals and captivating stories that inform, inspire, and empower people to address our Nation's most pressing water issues. USGS data science and visualization experts use visualizations to communicate water data in compelling and often interactive ways when static images or written narrative can’t effectively communicate the interconnectivity and...Rapid Deployment Gages (RDGs)
Rapid Deployment Gages (RDGs) are fully-functional streamgages designed to be deployed quickly and temporarily to measure and transmit stream stage data in emergency situations.StreamStats: Streamflow Statistics and Spatial Analysis Tools for Water-Resources Applications
StreamStats provides access to spatial analytical tools that are useful for water-resources planning and management, and for engineering and design purposes. The map-based user interface can be used to delineate drainage areas, get basin characteristics and estimates of flow statistics, and more. Available information varies from state to state.Water Science School
Welcome to the U.S. Geological Survey's (USGS) Water Science School. We offer information on many aspects of water, along with pictures, data, maps, and an interactive center where you can give opinions and test your water knowledge.
Surge, Wave, and Tide Hydrodynamics (SWaTH) Network
During large coastal storms, the storm surge and waves are the main cause of destruction and landscape change, transporting saline water, sediment, and debris inland. The USGS, in collaboration with stakeholders, has constructed a national Surge, Wave, and Tide Hydrodynamics (SWaTH) Network for the Atlantic, Eastern Pacific, and Central Pacific. SWaTH monitors and documents the height, extent, and...USGS Flood Event Viewer: Providing Hurricane and Flood Response Data
During large, short-term floods, the USGS collects additional data to help document these high-water events. This data is uploaded to the USGS Short-Term Network (STN) for long-term archival, and served out to the public through the USGS Flood Event Viewer (FEV) which provides convenient, map-based access to storm-surge and other event-based data.Historical Flooding
The USGS provides practical, unbiased information about the Nation's rivers and streams that is crucial in mitigating hazards associated with floods. This site provides information about the USGS activities, data, and services provided during regional high-flow events, such as hurricanes or multi-state flooding events. The USGS response to these events is typically managed by the National Flood...Flood Inundation Mapping (FIM) Program
Floods are the leading cause of natural-disaster losses in the U.S. More than 75 percent of declared Federal disasters are related to floods, and annual flood losses average almost $8 billion with over 90 fatalities per year. Although the amount of fatalities has declined due to improved early warning systems, economic losses continue to rise with increased urbanization in flood-hazard areas. - Data
Below are data or web applications associated with USGS flood information and activities.
- Publications
Below are publications associated with USGS flood information and activities.
Preliminary stage and streamflow data at selected U.S. Geological Survey streamgages in New England for the floods of April 2019
The combination of rainfall and snowmelt in northern New England and rainfall in southern New England resulted in minor to major flooding from April 15 to 24, 2019, according to stage and streamflow data collected at 63 selected U.S. Geological Survey (USGS) streamgages. A typical USGS streamgage measures and records stream stage and estimates streamflow based on a relation (rating curve) of discr
AuthorsRichard G. Kiah, Brianna A. Smith, Nicholas W. StasulisIdentifying and preserving high-water mark data
High-water marks provide valuable data for understanding recent and historical flood events. The proper collection and recording of high-water mark data from perishable and preserved evidence informs flood assessments, research, and water resource management. Given the high cost of flooding in developed areas, experienced hydrographers, using the best available techniques, can contribute high-qualAuthorsTodd A. Koenig, Jennifer L. Bruce, Jim O'Connor, Benton D. McGee, Robert R. Holmes, Ryan Hollins, Brandon T. Forbes, Michael S. Kohn, Mathew Schellekens, Zachary W. Martin, Marie C. Peppler100-Year flood–it's all about chance
In the 1960's, the United States government decided to use the 1-percent annual exceedance probability (AEP) flood as the basis for the National Flood Insurance Program. The 1-percent AEP flood was thought to be a fair balance between protecting the public and overly stringent regulation. Because the 1-percent AEP flood has a 1 in 100 chance of being equaled or exceeded in any 1 year, and it has aAuthorsRobert R. Holmes, Karen Dinicola - Web Tools
Below are data or web applications associated with USGS flood information and activities.
WaterAlert
The U.S. Geological Survey WaterAlert service provides notifications to your email or phone for changes in water conditions based on thresholds you choose.
ByWater Resources Mission Area, Kansas Water Science Center, New Jersey Water Science Center, New York Water Science Center, Ohio-Kentucky-Indiana Water Science Center, Oregon Water Science Center, Upper Midwest Water Science Center, Wyoming-Montana Water Science Center, Hydrologic Instrumentation Facility (HIF), National Water Quality Laboratory, Water Science SchoolNational Water Dashboard (NWD)
The National Water Dashboard (NWD) is a mobile, interactive tool that provides real-time information on water levels, weather, and flood forecasts - all in one place on a computer, smartphone, or other mobile device. The NWD presents real-time stream, lake and reservoir, precipitation, and groundwater data from more than 13,500 USGS observation stations across the country.
ByWater Resources Mission Area, Alaska Science Center, Arizona Water Science Center, California Water Science Center, Caribbean-Florida Water Science Center (CFWSC), Central Midwest Water Science Center, Colorado Water Science Center, Dakota Water Science Center, Idaho Water Science Center, Kansas Water Science Center, Lower Mississippi-Gulf Water Science Center, Maryland-Delaware-D.C. Water Science Center, Nebraska Water Science Center, Nevada Water Science Center, New England Water Science Center, New Jersey Water Science Center, New Mexico Water Science Center, New York Water Science Center, Ohio-Kentucky-Indiana Water Science Center, Oklahoma-Texas Water Science Center, Oregon Water Science Center, Pacific Islands Water Science Center, Pennsylvania Water Science Center, South Atlantic Water Science Center (SAWSC), Upper Midwest Water Science Center, Utah Water Science Center, Virginia and West Virginia Water Science Center, Washington Water Science Center, Wyoming-Montana Water Science Center, Hydrologic Instrumentation Facility (HIF), Saline Lakes Ecosystems Integrated Water Availability AssessmentUSGS Flood Event Viewer
During large, short-term events, the USGS collects streamflow and additional data (including storm tide, wave height, high-water marks, and additional sensor deployments) to aid in documenting flood events. The USGS Flood Event Viewer provides convenient, map-based access to downloadable event-based data.
StreamStats Application
StreamStats provides access to spatial analytical tools that are useful for water-resources planning and management, and for engineering and design purposes. The map-based user interface can be used to delineate drainage areas, get basin characteristics and estimates of flow statistics, and more. Available information varies from state to state.
ByWater Resources Mission Area, New England Water Science Center, New Jersey Water Science Center, New Mexico Water Science Center, New York Water Science Center, Oregon Water Science Center, Pacific Islands Water Science Center, Pennsylvania Water Science Center, South Atlantic Water Science Center (SAWSC), Upper Midwest Water Science Center, Wyoming-Montana Water Science CenterFlood Inundation Mapper
USGS Flood Inundation Maps, along with Internet information regarding current stage from the USGS streamgage, provide emergency management personnel and residents with information that is critical for flood-response activities, such as evacuations and road closures, as well as for post-flood recovery efforts.
- Software
Below are software products associated with USGS flood information and activities.
National Streamflow Statistics (NSS) Application - Formerly NSS Program
The USGS develops regression equations for estimating streamflow statistics for every state, Puerto Rico, and a number of metropolitan areas in the U.S. These equations have been compiled into the National Streamflow Statistics (NSS) Application for design, planning, management, and regulatory purposes. These estimates are often needed at ungaged sites where no observed flow data are available.