



The next generation of the Seabed Observation and Sampling System—SEABOSS 3.0—is steadily coming to life.
Images
Woods Hole Coastal and Marine Science Center images
Filter Total Items: 1357
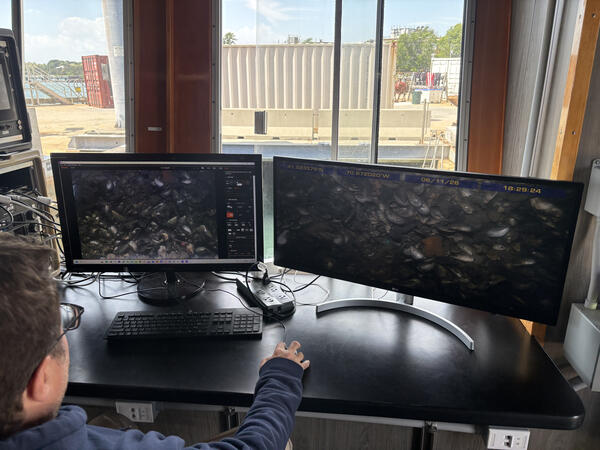
SEABOSS 3.0 Test
The next generation of the Seabed Observation and Sampling System—SEABOSS 3.0—is steadily coming to life.
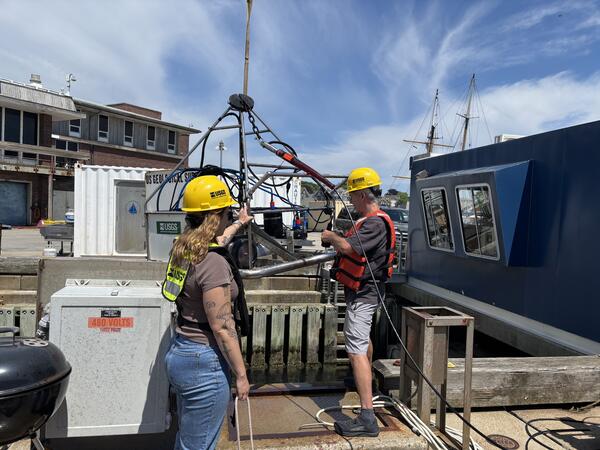
SEABOSS 3.0 Test
The next generation of the Seabed Observation and Sampling System—SEABOSS 3.0—is steadily coming to life.
The next generation of the Seabed Observation and Sampling System—SEABOSS 3.0—is steadily coming to life.
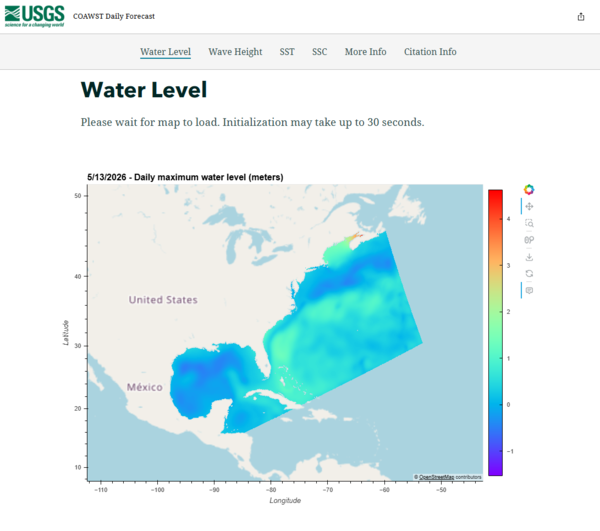
COAWST Water Level
COAWST Daily Forecast showing daily maximum water level in meters for 5/13/26.
COAWST Daily Forecast showing daily maximum water level in meters for 5/13/26.
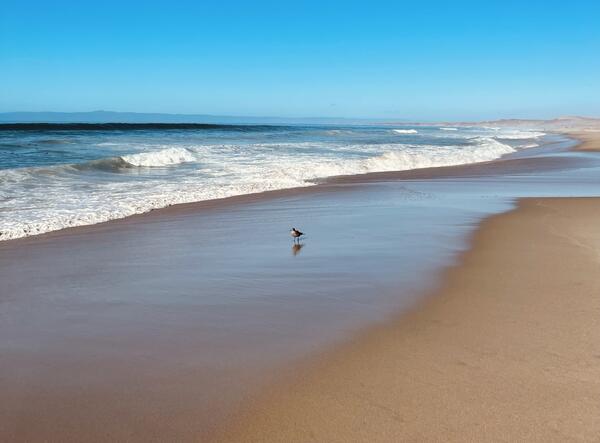
Sandy Shoreline
Sandy shoreline with bird on the wet sand.
Sandy shoreline with bird on the wet sand.
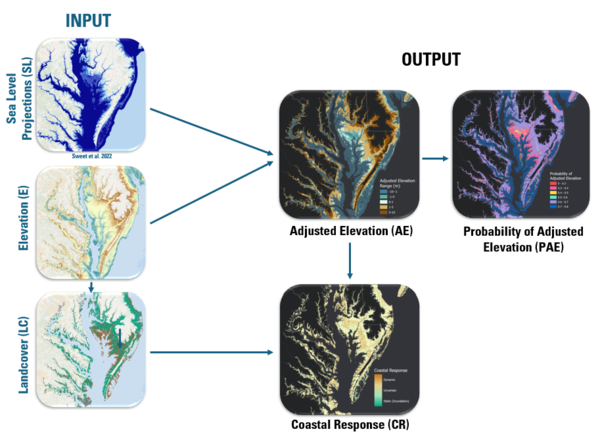
Coastal Response Likelihood Workflow
Conceptual diagram showing the structure of the Bayesian network used to assess potential sea-level rise impacts on the coastal landscape.
Conceptual diagram showing the structure of the Bayesian network used to assess potential sea-level rise impacts on the coastal landscape.
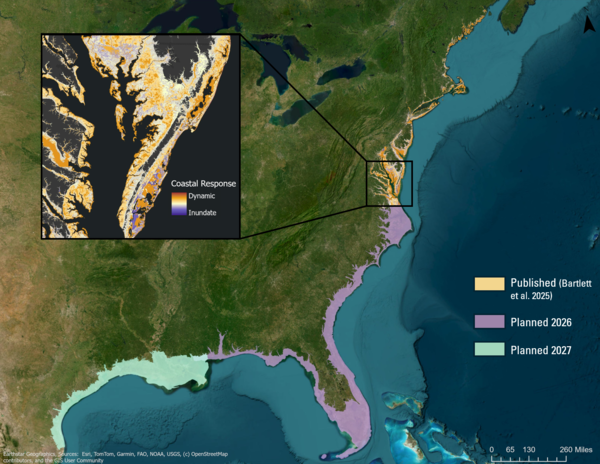
Coastal Response
Geographic extent of Coastal Response data layers by publication timeline. Results for the Northeast U.S. are available as of 2025 (inset). Data for the Southeast Atlantic and eastern Gulf of Mexico are anticipated in mid-2026, with expansion to the western Gulf planned for 2027.
Geographic extent of Coastal Response data layers by publication timeline. Results for the Northeast U.S. are available as of 2025 (inset). Data for the Southeast Atlantic and eastern Gulf of Mexico are anticipated in mid-2026, with expansion to the western Gulf planned for 2027.
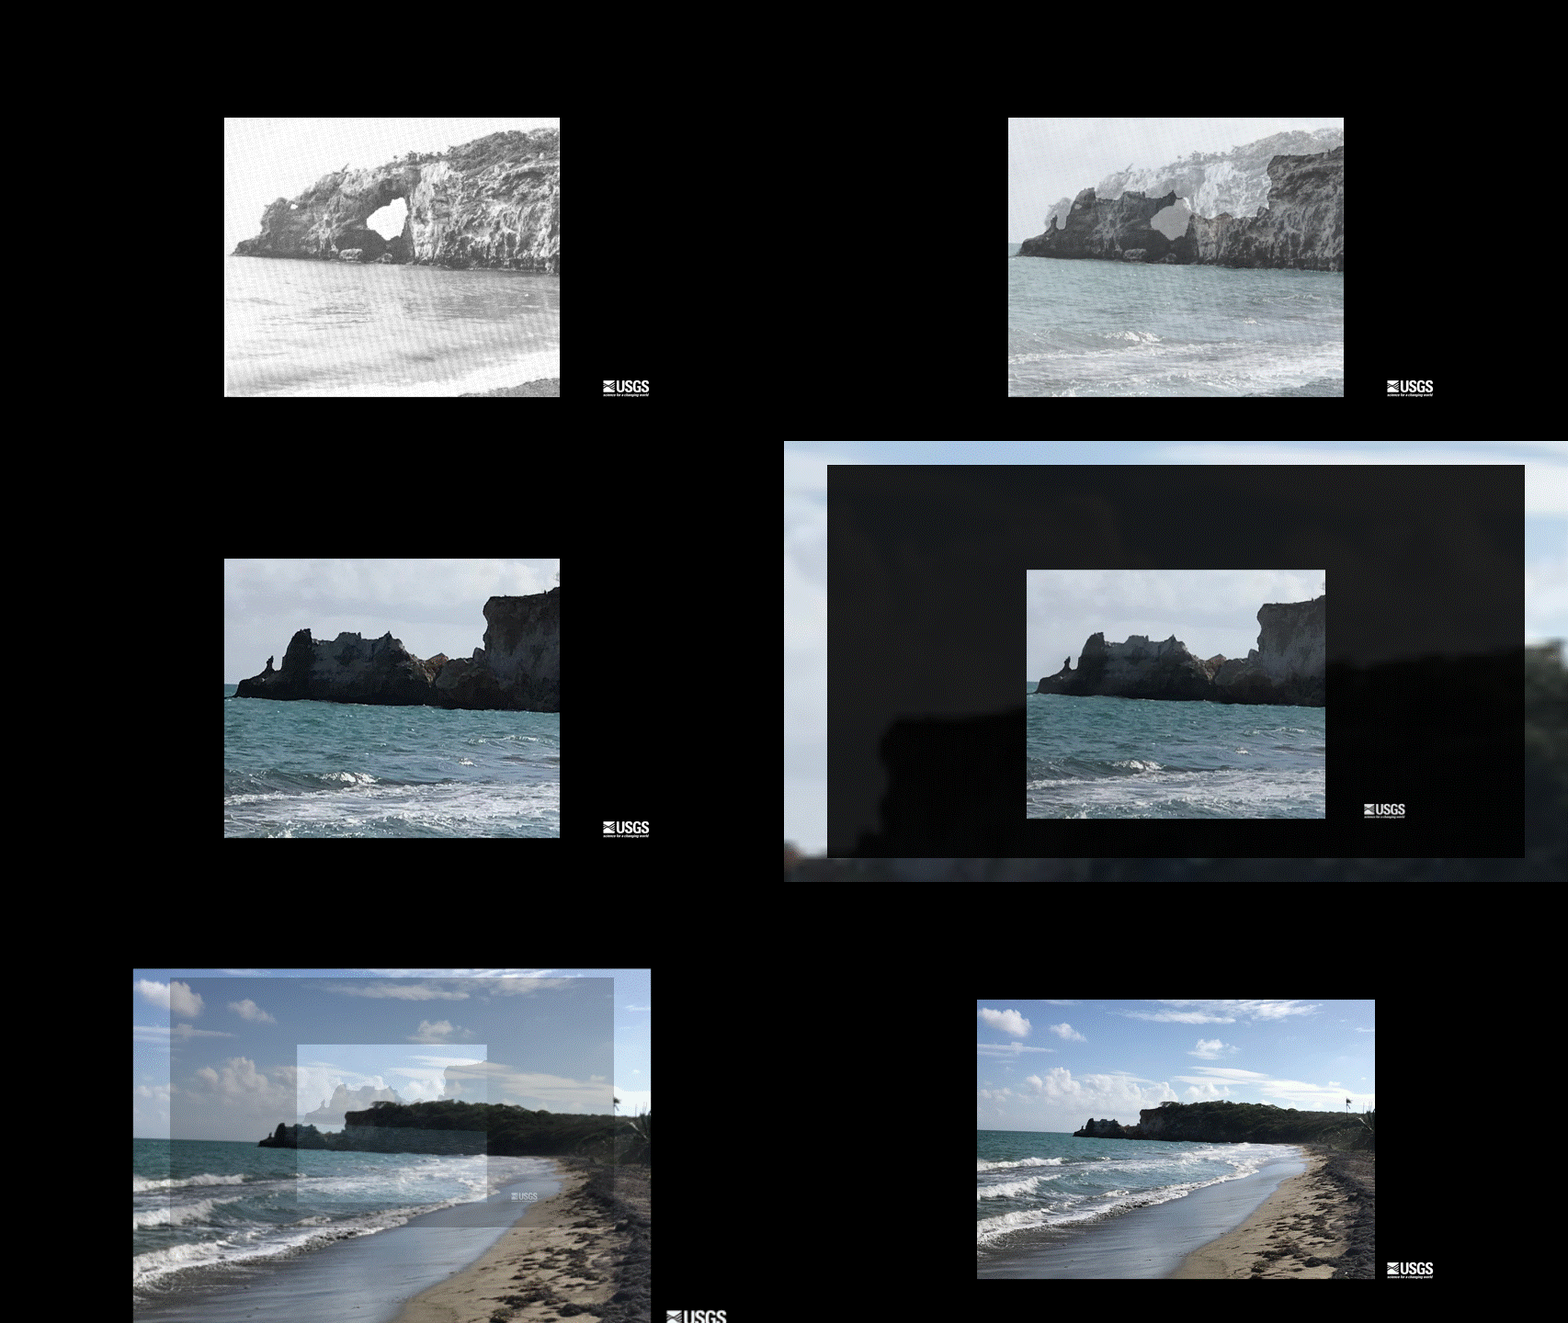
Collapsed natural arch of Punta Ventana, Guayanilla, Puerto Rico
Collapsed natural arch of Punta Ventana, Guayanilla, Puerto RicoThe starting view is from January, 1970, a field photo of Punta Ventana (“Window Point”) at Guayanilla, Puerto Rico (Monroe, 1980). The image fades to the March 5, 2020 color photo of the same location (ten Brink, 2020). The natural arch had collapsed from earthquake shaking on January 6, 2020 during the 2020 Southwest Puerto Rico Earthquake Sequence.
Collapsed natural arch of Punta Ventana, Guayanilla, Puerto Rico
Collapsed natural arch of Punta Ventana, Guayanilla, Puerto RicoThe starting view is from January, 1970, a field photo of Punta Ventana (“Window Point”) at Guayanilla, Puerto Rico (Monroe, 1980). The image fades to the March 5, 2020 color photo of the same location (ten Brink, 2020). The natural arch had collapsed from earthquake shaking on January 6, 2020 during the 2020 Southwest Puerto Rico Earthquake Sequence.
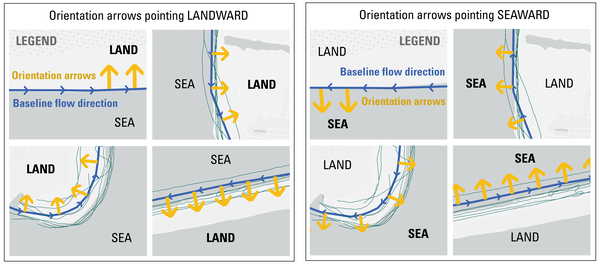
DSAS Landward vs Seaward
The Digital Shoreline Analysis System (DSAS) version 6 is a standalone application that calculates shoreline or boundary change over time. The GIS of a user’s choice is used to prepare the data for DSAS. Like previous versions, DSAS v.6 enables a user to calculate rate-of-change statistics from multiple historical shoreline positions.
The Digital Shoreline Analysis System (DSAS) version 6 is a standalone application that calculates shoreline or boundary change over time. The GIS of a user’s choice is used to prepare the data for DSAS. Like previous versions, DSAS v.6 enables a user to calculate rate-of-change statistics from multiple historical shoreline positions.
DSAS Elements
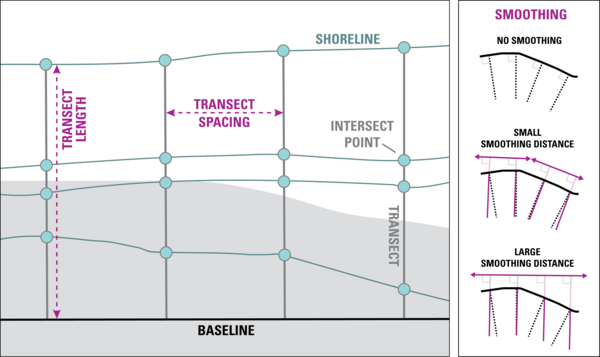
DSAS generates transects that are cast perpendicular to the reference baseline to intersect shorelines at a user-specified spacing alongshore.
DSAS generates transects that are cast perpendicular to the reference baseline to intersect shorelines at a user-specified spacing alongshore.
DSAS Software
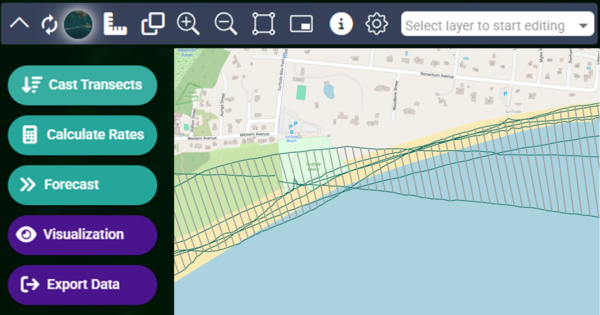
The Digital Shoreline Analysis System (DSAS) version 6 is a standalone application that calculates shoreline or boundary change over time. The GIS of a user’s choice is used to prepare the data for DSAS. Like previous versions, DSAS v.6 enables a user to calculate rate-of-change statistics from multiple historical shoreline positions.
The Digital Shoreline Analysis System (DSAS) version 6 is a standalone application that calculates shoreline or boundary change over time. The GIS of a user’s choice is used to prepare the data for DSAS. Like previous versions, DSAS v.6 enables a user to calculate rate-of-change statistics from multiple historical shoreline positions.
DSAS step by step
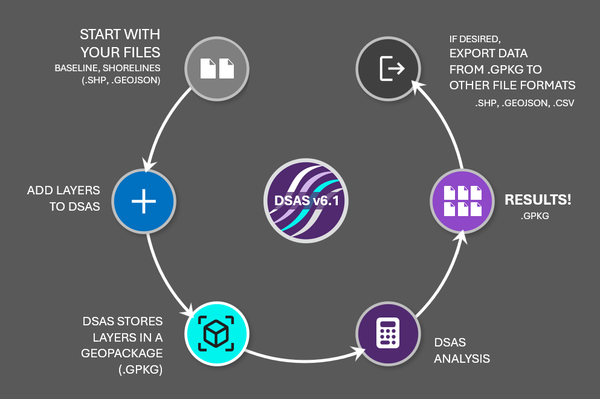
The Digital Shoreline Analysis System (DSAS) version 6 is a standalone application that calculates shoreline or boundary change over time. The GIS of a user’s choice is used to prepare the data for DSAS. Like previous versions, DSAS v.6 enables a user to calculate rate-of-change statistics from multiple historical shoreline positions.
The Digital Shoreline Analysis System (DSAS) version 6 is a standalone application that calculates shoreline or boundary change over time. The GIS of a user’s choice is used to prepare the data for DSAS. Like previous versions, DSAS v.6 enables a user to calculate rate-of-change statistics from multiple historical shoreline positions.
DSAS v6.1 Infographic
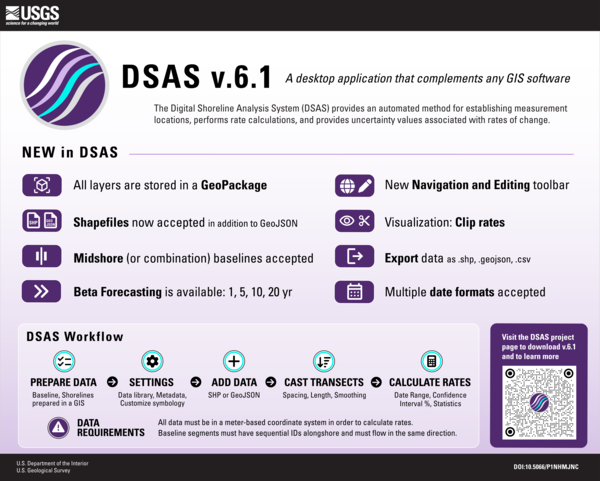
The Digital Shoreline Analysis System (DSAS) version 6 is a standalone application that calculates shoreline or boundary change over time. The GIS of a user’s choice is used to prepare the data for DSAS. Like previous versions, DSAS v.6 enables a user to calculate rate-of-change statistics from multiple historical shoreline positions.
The Digital Shoreline Analysis System (DSAS) version 6 is a standalone application that calculates shoreline or boundary change over time. The GIS of a user’s choice is used to prepare the data for DSAS. Like previous versions, DSAS v.6 enables a user to calculate rate-of-change statistics from multiple historical shoreline positions.
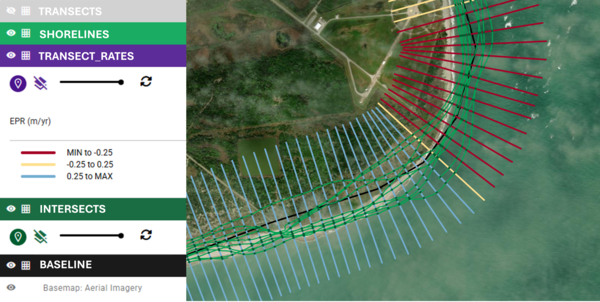
DSAS Sample Data
The Digital Shoreline Analysis System (DSAS) version 6 is a standalone application that calculates shoreline or boundary change over time. The GIS of a user’s choice is used to prepare the data for DSAS. Like previous versions, DSAS v.6 enables a user to calculate rate-of-change statistics from multiple historical shoreline positions.
The Digital Shoreline Analysis System (DSAS) version 6 is a standalone application that calculates shoreline or boundary change over time. The GIS of a user’s choice is used to prepare the data for DSAS. Like previous versions, DSAS v.6 enables a user to calculate rate-of-change statistics from multiple historical shoreline positions.
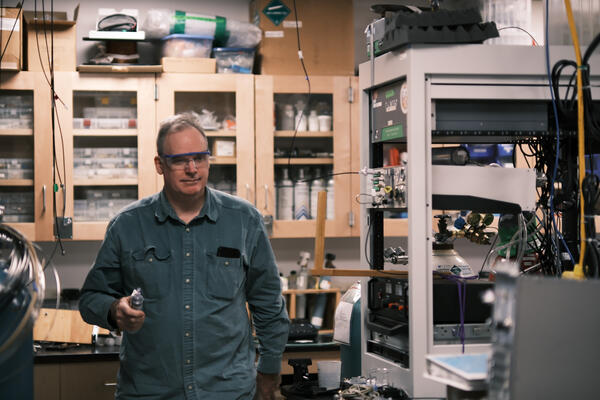
Testing DSIM
Testing a USGS patented device (DSIM) and measuring it's performance with a new analytical upgrade recently designed and installed. The DSIM allows for gas samples to be put into a spectrometer and measured in a closed loop, which increased the data signal fidelity, repeatability, and amount an analyte used.
Testing a USGS patented device (DSIM) and measuring it's performance with a new analytical upgrade recently designed and installed. The DSIM allows for gas samples to be put into a spectrometer and measured in a closed loop, which increased the data signal fidelity, repeatability, and amount an analyte used.
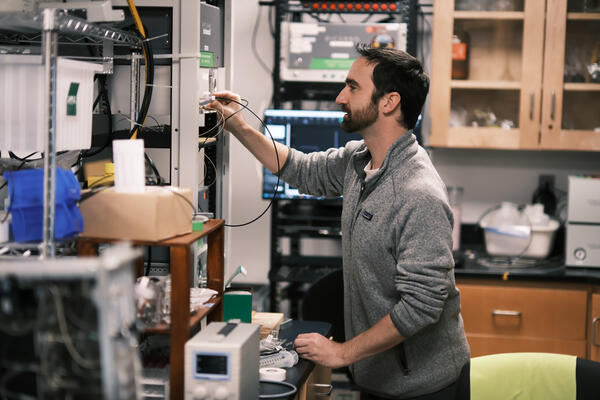
Testing DSIM
Testing a USGS patented device (DSIM) and measuring it's performance with a new analytical upgrade recently designed and installed. The DSIM allows for gas samples to be put into a spectrometer and measured in a closed loop, which increased the data signal fidelity, repeatability, and amount an analyte used.
Testing a USGS patented device (DSIM) and measuring it's performance with a new analytical upgrade recently designed and installed. The DSIM allows for gas samples to be put into a spectrometer and measured in a closed loop, which increased the data signal fidelity, repeatability, and amount an analyte used.
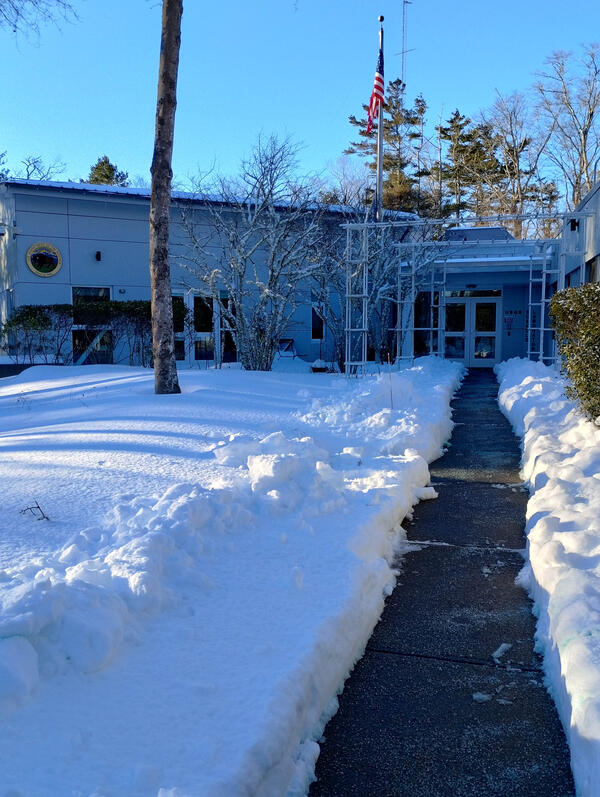
Snow Day
A snow covered science center in Woods Hole, Massachusetts after a powerful nor'easter hit the Cape Cod on January 25, 2026.
A snow covered science center in Woods Hole, Massachusetts after a powerful nor'easter hit the Cape Cod on January 25, 2026.
Analytical Laboratories
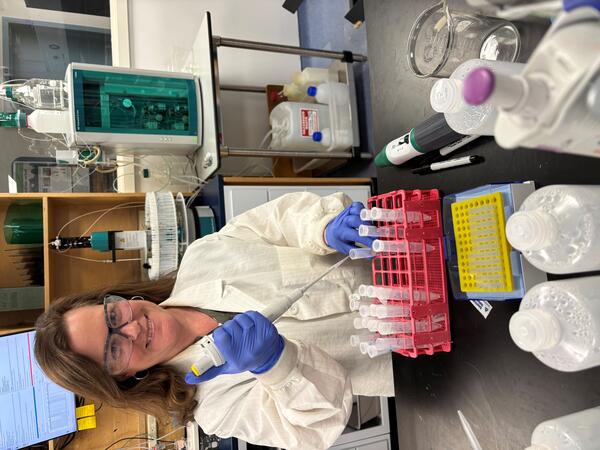
The Core Laboratories Project is a key service for our center, providing vital support to a variety of projects studying everything from coastal wetlands to deep sea sediment and minerals. The project team delivers high-quality data through advanced analytical techniques and maintains laboratory equipment.
The Core Laboratories Project is a key service for our center, providing vital support to a variety of projects studying everything from coastal wetlands to deep sea sediment and minerals. The project team delivers high-quality data through advanced analytical techniques and maintains laboratory equipment.
Interns in the field
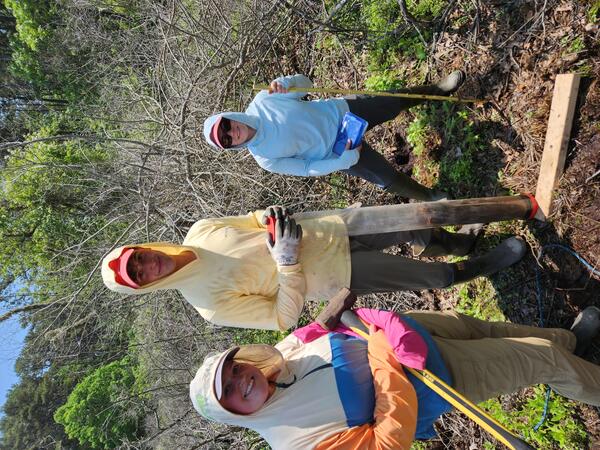
Interns working in a coastal wetland.
Interns working in a coastal wetland.
WH Center Director in the Field
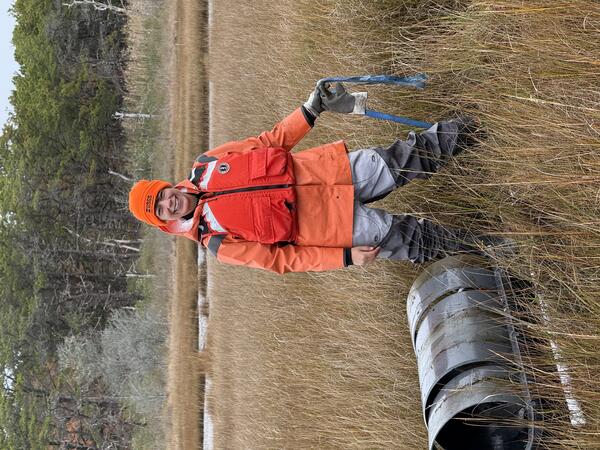
Coastal wetlands that have been damaged or destroyed can lose their ability to capture carbon dioxide and make the large quantities of carbon stored vulnerable to release into the atmosphere—contributing to climate change.
Coastal wetlands that have been damaged or destroyed can lose their ability to capture carbon dioxide and make the large quantities of carbon stored vulnerable to release into the atmosphere—contributing to climate change.
Interns in the core lab
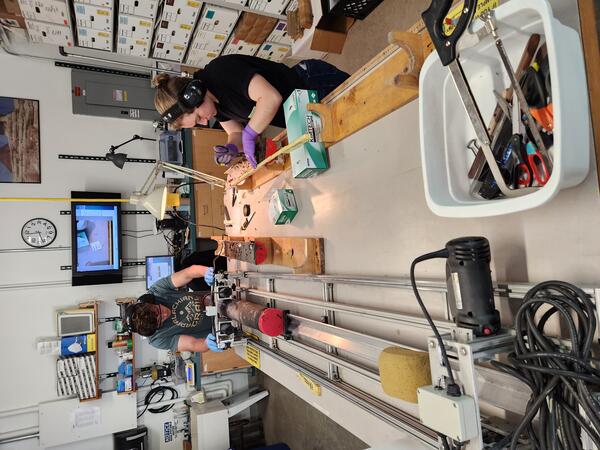
Interns working on with cores in the lab
Interns working on with cores in the lab
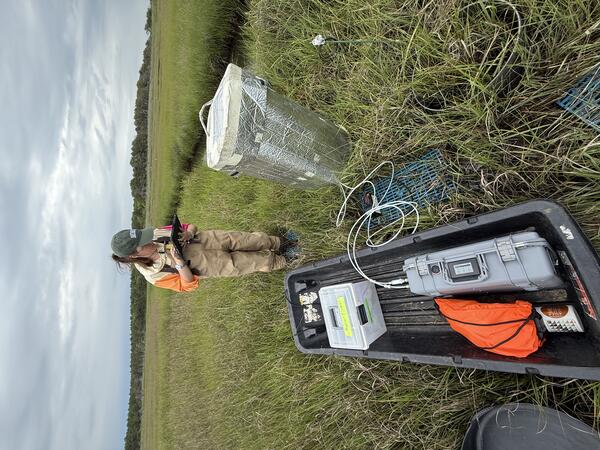
Coastal Ecosystem Environmental Chemistry
Coastal wetlands that have been damaged or destroyed can lose their ability to capture carbon dioxide and make the large quantities of carbon stored vulnerable to release into the atmosphere—contributing to climate change.
Coastal wetlands that have been damaged or destroyed can lose their ability to capture carbon dioxide and make the large quantities of carbon stored vulnerable to release into the atmosphere—contributing to climate change.