
Person in hard hat looks through windows down into the Itaipu Binacional hydroelectric dam control room. The binational dam is located on the border of Brazil and Paraguay on the Parana River.
Images
Explore water-related photography, imagery, and illustrations.
Filter Total Items: 2553

Itaipu Binacional hydroelectric dam control room
Person in hard hat looks through windows down into the Itaipu Binacional hydroelectric dam control room. The binational dam is located on the border of Brazil and Paraguay on the Parana River.

Itaipu Binacional Dam sign in front of spillway
Itaipu Binacional Dam sign in front of spillway. The binational dam is located on the Parana River between Brazil and Paraguay.
Itaipu Binacional Dam sign in front of spillway. The binational dam is located on the Parana River between Brazil and Paraguay.

UN Water Conference speakers
Speakers at United Nations 2023 Water Conference side event titled, “International and Transboundary Cooperation of Integrated Water Management: From Data Collection to Implementation”. Hydrologist Joel Groten is third from left.
Speakers at United Nations 2023 Water Conference side event titled, “International and Transboundary Cooperation of Integrated Water Management: From Data Collection to Implementation”. Hydrologist Joel Groten is third from left.

Discussion between participants at United Nations 2023 Water Conference
Discussion between participants at United Nations 2023 Water ConferenceDiscussion between participants at United Nations 2023 Water Conference side event titled, “International and Transboundary Cooperation of Integrated Water Management: From Data Collection to Implementation”.

Speakers who presented at United Nations 2023 Water Conference
Speakers who presented at United Nations 2023 Water ConferenceSpeakers who presented at United Nations 2023 Water Conference side event titled, “International and Transboundary Cooperation of Integrated Water Management: From Data Collection to Implementation”.

Joel Groten at the United Nations General Assembly.
Joel Groten at the United Nations General Assembly.Joel Groten at the United Nations General Assembly during the UN2023 Water Conference.
Joel Groten at the United Nations General Assembly.
Joel Groten at the United Nations General Assembly.Joel Groten at the United Nations General Assembly during the UN2023 Water Conference.

United Nations General Assembly
View of participants from behind looking forward in the United Nations general assembly at the United Nations 2023 Water Conference.
View of participants from behind looking forward in the United Nations general assembly at the United Nations 2023 Water Conference.

#WATERACTION sign at the United Nations 2023 Water Conference
#WATERACTION sign at the United Nations 2023 Water Conference#WATERACTION sign at the United Nations 2023 Water Conference. Large individual letter sign that states "#wateraction" with New York City skyline in background.
#WATERACTION sign at the United Nations 2023 Water Conference
#WATERACTION sign at the United Nations 2023 Water Conference#WATERACTION sign at the United Nations 2023 Water Conference. Large individual letter sign that states "#wateraction" with New York City skyline in background.

United Nations Headquarters in New York City
United Nations Headquarters in New York City. View looking up at United Nations headquarters building with flags in foreground.
United Nations Headquarters in New York City. View looking up at United Nations headquarters building with flags in foreground.

Gage Greatness - Bracket - Round 2.jpg
Illustration of Gage Greatness Round 2 bracket. Winners are shown through Round 1.
Illustration of Gage Greatness Round 2 bracket. Winners are shown through Round 1.

Gage Greatness Bracket Round 1
At the USGS, we monitor our nation’s water. Our data informs many people, from kayakers to water managers. Gage Greatness allows any Twitter user to vote for their favorite gage (data collection station).
At the USGS, we monitor our nation’s water. Our data informs many people, from kayakers to water managers. Gage Greatness allows any Twitter user to vote for their favorite gage (data collection station).

Organic Geochemistry Research Laboratory, KS WSC
This is the instrument laboratory of the Organic Geochemistry Research Laboratory located in the KS WSC.
This is the instrument laboratory of the Organic Geochemistry Research Laboratory located in the KS WSC.
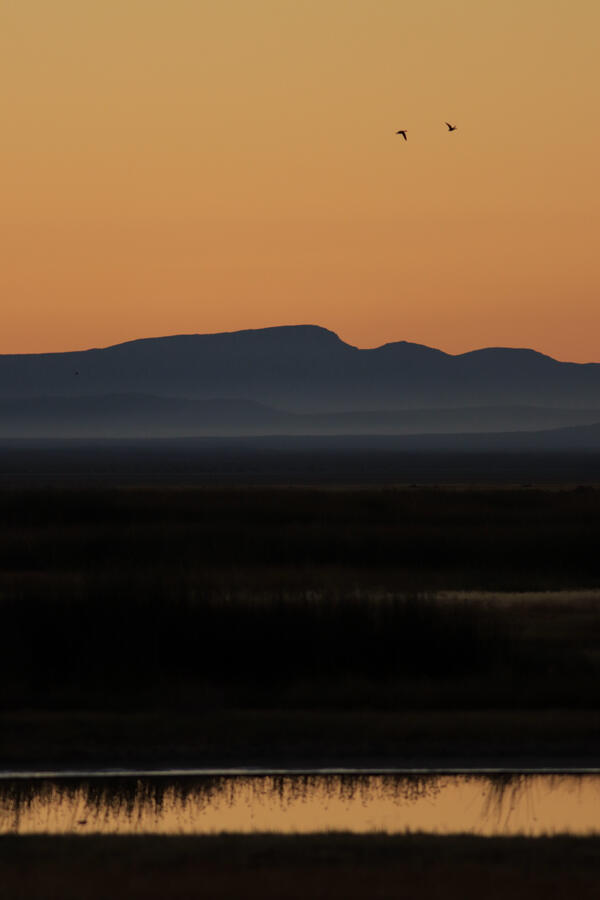
Summer Lake Wildlife Area
Photograph of Summer Lake Wildlife Area, an important stopping spot for migratory birds on their spring and fall migration flights.
By
Ecosystems Mission Area, Water Resources Mission Area, Species Management Research Program, Forest and Rangeland Ecosystem Science Center, Fort Collins Science Center, Nevada Water Science Center, Utah Water Science Center, Western Ecological Research Center (WERC), Saline Lake Ecosystems Integrated Water Availability Assessment

Wolf River instrument shelter.jpg
USGS-HIF instrument shelter located on the left bank on the upstream side of the bridge with Iridium and GOES antennas. (Credit: Scott Kimball, USGS)
USGS-HIF instrument shelter located on the left bank on the upstream side of the bridge with Iridium and GOES antennas. (Credit: Scott Kimball, USGS)

HIF Corral testing site.jpg
USGS-HIF rain gauge and meteorological instrument testing site, “the Corral,” with multiple instruments currently under test. (Credit: Scott Kimball, USGS)
USGS-HIF rain gauge and meteorological instrument testing site, “the Corral,” with multiple instruments currently under test. (Credit: Scott Kimball, USGS)

HIF Pearl River testing pier.jpg
USGS-HIF Gaging station with elevated platform, two stilling wells and shelters, and plenty of work area for evaluation instruments. (Credit: Scott Kimball, USGS)
USGS-HIF Gaging station with elevated platform, two stilling wells and shelters, and plenty of work area for evaluation instruments. (Credit: Scott Kimball, USGS)

Radon in New Hampshire Groundwater
USGS map identifying the percent probability for any location in New Hampshire to have groundwater with radon concentrations greater than the state government’s standard of 2,000 picocuries per liter for drinking water.
USGS map identifying the percent probability for any location in New Hampshire to have groundwater with radon concentrations greater than the state government’s standard of 2,000 picocuries per liter for drinking water.

Illinois River Basin low-level flight overview
This map shows the airborne geophysical survey area and planned flight paths across the Illinois River Basin in Illinois and northwest Indiana. Surveys will not occur directly above populated areas. Planned flight lines and survey progress can be found online.
(USGS map)
This map shows the airborne geophysical survey area and planned flight paths across the Illinois River Basin in Illinois and northwest Indiana. Surveys will not occur directly above populated areas. Planned flight lines and survey progress can be found online.
(USGS map)

Thumbnail of River Conditions Oct 1 thru Sept 30 2022
Thumbnail of River Conditions Oct 1 thru Sept 30 2022This is a still, thumbnail image for the U.S. river conditions for Oct 1, 2022 through September 30, 2022.
Thumbnail of River Conditions Oct 1 thru Sept 30 2022
Thumbnail of River Conditions Oct 1 thru Sept 30 2022This is a still, thumbnail image for the U.S. river conditions for Oct 1, 2022 through September 30, 2022.

Thumbnail of River Conditions from Oct 1 2022 to Dec 31 2022
Thumbnail of River Conditions from Oct 1 2022 to Dec 31 2022Thumbnail image of US river conditions from October 1, 2022 to December 31, 2022.
Thumbnail of River Conditions from Oct 1 2022 to Dec 31 2022
Thumbnail of River Conditions from Oct 1 2022 to Dec 31 2022Thumbnail image of US river conditions from October 1, 2022 to December 31, 2022.

December 2022 Streamflow Tile Map
A tile map of the US showing streamgages by flow levels through the month of December 2022. For each state, an area chart shows the proportion of streamgages in wet, normal, or dry conditions. Streamflow conditions are quantified using percentiles comparing the past month’s flow levels to the historic record for each streamgage.
A tile map of the US showing streamgages by flow levels through the month of December 2022. For each state, an area chart shows the proportion of streamgages in wet, normal, or dry conditions. Streamflow conditions are quantified using percentiles comparing the past month’s flow levels to the historic record for each streamgage.