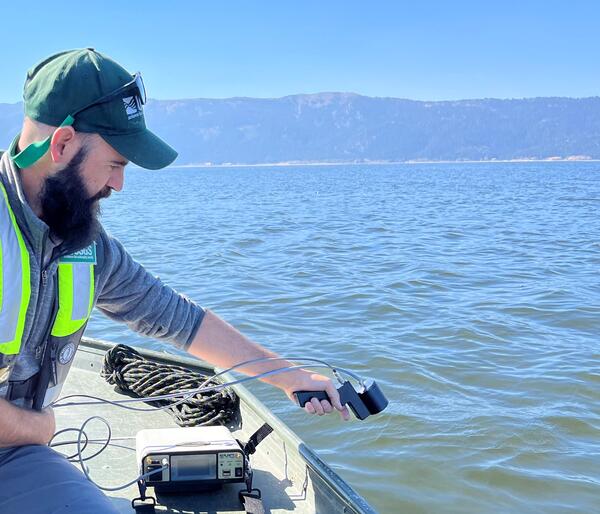
A photograph taken near USGS 01034000 Piscataquis River at Medford, Maine on June 6, 2022 when the river was experiencing below average flow conditions as a result of a continued drought.
Images
Explore water-related photography, imagery, and illustrations.
A photograph taken near USGS 01034000 Piscataquis River at Medford, Maine on June 6, 2022 when the river was experiencing below average flow conditions as a result of a continued drought.
A photograph of the Piscatquis River near Dover-Foxcroft, Maine taken on June 6, 2022, when the river was experiencing below average flow conditions due to a continued drought. USGS Current Conditions for USGS 01031500 Piscataquis River near Dover-Foxcroft, Maine
Map showing helicopter survey area and near Granby, Colo.
Map showing helicopter survey area and near Granby, Colo.Map showing helicopter survey area and near Granby, Colo. Surveys will not occur directly above populated areas. Black circle indicates study area.
Map showing helicopter survey area and near Granby, Colo.
Map showing helicopter survey area and near Granby, Colo.Map showing helicopter survey area and near Granby, Colo. Surveys will not occur directly above populated areas. Black circle indicates study area.
Field Photo Friday image for 6.3.22, USGS gage 02172020, on the Cooper River at Pimlico, SC
Field Photo Friday image for 6.3.22, USGS gage 02172020, on the Cooper River at Pimlico, SCField Photo Friday image for 6.3.22, USGS gage 02172020, on the Cooper River at Pimlico, SC.
Field Photo Friday image for 6.3.22, USGS gage 02172020, on the Cooper River at Pimlico, SC
Field Photo Friday image for 6.3.22, USGS gage 02172020, on the Cooper River at Pimlico, SCField Photo Friday image for 6.3.22, USGS gage 02172020, on the Cooper River at Pimlico, SC.
A cartogram map of the US with proportional area charts for each state showing the proportion of streamgages by flow levels, categorized using percentile bins. Streamflow level percentiles are calculated using the historic daily record for each gage, and binned to reflect whether flow conditions are wetter or drier than the historical record.
Hi, I'm Salty, Drippy's saline counterpart! Did you know that one way to produce table salt is to evaporate saline water in evaporation ponds, a technique used by people for thousands of years?
Sampling surface water on the Animas River, New Mexico, 2022
Sampling surface water on the Animas River, New Mexico, 2022USGS researchers collect surface water samples on the Animas River, New Mexico, June 2022
Sampling surface water on the Animas River, New Mexico, 2022
Sampling surface water on the Animas River, New Mexico, 2022USGS researchers collect surface water samples on the Animas River, New Mexico, June 2022
Collection Of Sediment And Water Sampling Prior To The Possible Occurrence Of Oil Contamination From The Deepwater Horizon Oil Well At Egmont Key, Florida
Collection Of Sediment And Water Sampling Prior To The Possible Occurrence Of Oil Contamination From The Deepwater Horizon Oil Well At Egmont Key, FloridaBruce Bernard (left) and Scott McBride (right) obtain water and sediment samples at Egmont Key which is about 1 mile west of the mouth of Tampa Bay in the Gulf of America. Samples were collected June 14, 2010 prior to the possible occurrence of oil contamination from the Deepwater Horizon's oil well.
Collection Of Sediment And Water Sampling Prior To The Possible Occurrence Of Oil Contamination From The Deepwater Horizon Oil Well At Egmont Key, Florida
Collection Of Sediment And Water Sampling Prior To The Possible Occurrence Of Oil Contamination From The Deepwater Horizon Oil Well At Egmont Key, FloridaCollection Of Sediment And Water Sampling Prior To The Possible Occurrence Of Oil Contamination From The Deepwater Horizon Oil Well At Egmont Key, Florida
Collection Of Sediment And Water Sampling Prior To The Possible Occurrence Of Oil Contamination From The Deepwater Horizon Oil Well At Egmont Key, FloridaBruce Bernard (left) and Scott McBride (right) obtain water and sediment samples at Egmont Key which is about 1 mile west of the mouth of Tampa Bay in the Gulf of America. Samples were collected June 14, 2010 prior to the possible occurrence of oil contamination from the Deepwater Horizon's oil well.
Hey, I'm Drippy!
Sunset over Medina Lake near San Antonio, Texas, May 25, 2022
Sunset over Medina Lake near San Antonio, Texas, May 25, 2022Still-shot from webcam of sunset over Medina Lake near San Antonio, Texas, May 25, 2022. USGS Site: 08179500. Image from the Hydrologic Imagery Visualization and Information System (https://apps.usgs.gov/hivis/).
Participate in this national photo contest, #RecreateWithUSGS, for a chance to win the title of Water Recreation Photo Champion. More rules apply, see more details.
Scientists Deploy Buoy Platform with Water Quality Instruments in Southport Harbor, CT
Scientists Deploy Buoy Platform with Water Quality Instruments in Southport Harbor, CTUSGS deployed this buoy platform with connected water quality equipment in Southport Harbor, CT in May 2022.
Scientists Deploy Buoy Platform with Water Quality Instruments in Southport Harbor, CT
Scientists Deploy Buoy Platform with Water Quality Instruments in Southport Harbor, CTUSGS deployed this buoy platform with connected water quality equipment in Southport Harbor, CT in May 2022.
USGS deployed this buoy platform with connected water quality equipment in Southport Harbor, CT in May 2022.
A thumbnail image of the Vizlab logo. It features the words and a drawing of a gage.
A cartogram map of the US with proportional area charts for each state showing the proportion of streamgages by flow level. Streamflow levels are shown as percentiles of the historic daily record at each gage, and binned to reflect whether flow conditions are wetter or drier than the historical record.
Field Photo Friday image for 5.6.2022: USGS gage 10317500, on the North Fork, of the Humbolt River near Halleck, Nevada
Field Photo Friday image for 5.6.2022: USGS gage 10317500, on the North Fork, of the Humbolt River near Halleck, NevadaHere is the beautiful USGS gage 10317500, on the North Fork, of the Humbolt River near Halleck, Nevada, a bit Northwest from The East Humboldt Range and the Humboldt-Toiyabe National Forest. Water data back to 1913 are available online.
When are U.S. rivers wet or dry? This circular area chart displays the total flow rate in million cubic feet per second throughout a year. Total flow is derived from 1,865 USGS NWIS gages with near complete data for 1951-2020.
The rise and fall of the Delaware River salt front. Over time, the location of the salt front moves in response to regional weather patterns, sea level rise, and human impacts. The precise location of the salt front in the Delaware River Basin is based on the location in the river where the average chloride concentration is 250 mg/L.
A graphic showing a mountain with a snowcap. Names of scientists are next to arrows that show where on the mountain they work to measure snowmelt.
40+ Years of Streamflow Drought in the Upper Colorado River Basin
40+ Years of Streamflow Drought in the Upper Colorado River BasinA time series of streamflow drought events occurring across 122 stream gages in the Upper Colorado River basin from 1980 to present. Periods of streamflow drought are indicated for each of 122 gages in a beeswarm-like chart, with time on the x-axis. During time periods where many gages experienced drought, the swarm bulges due to many co-occurring events.
Changes in Temperature and Timing for Lake in the Contiguous U.S.
Changes in Temperature and Timing for Lake in the Contiguous U.S.A map of CONUS using angled wheat field vectors to compare lake growing degree days between the past (1981-1990) and present (2011-2020). The vectors are mapped to the number of growing degree days earlier or later on the x-axis, and the difference in temperature on the y-axis, resulting in vector angles spanning 360 degrees.