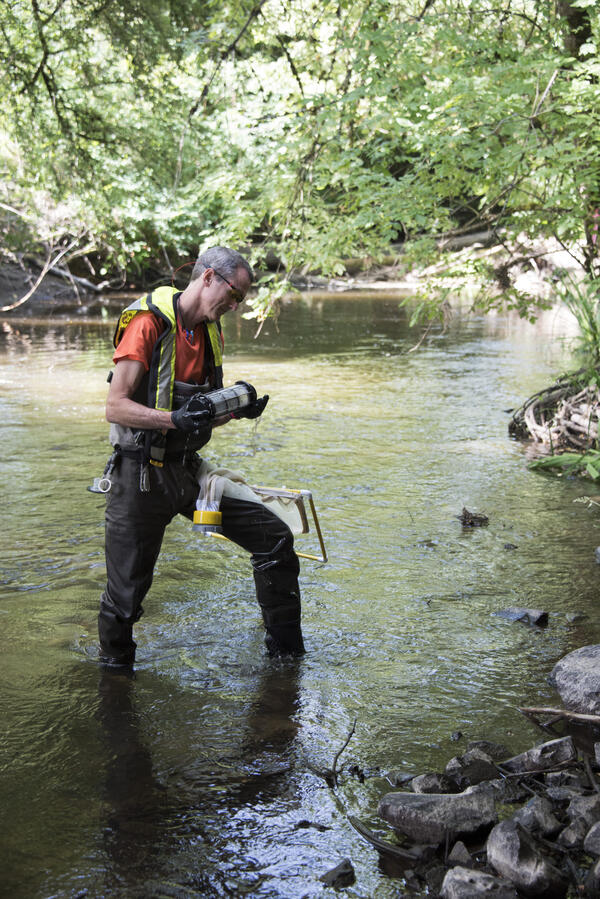
U.S. flag

An official website of the United States government

Images

Explore water-related photography, imagery, and illustrations.

Filter Total Items: 2539
Image: White River Flooding near Kadoka, SD
White River Flooding near Kadoka, SD

Flooding on the White River near Kadoka, SD, streamgage 06447000. Streamflow at this site was measured by USGS as about 26,000 cubic feet per second on May 18, 2015. Major flooding on the White River in South Dakota occurred in May 2015 following snow and rain events in western South Dakota.

Flooding on the White River near Kadoka, SD, streamgage 06447000. Streamflow at this site was measured by USGS as about 26,000 cubic feet per second on May 18, 2015. Major flooding on the White River in South Dakota occurred in May 2015 following snow and rain events in western South Dakota.

Image: White River Flooding near Kadoka, SD, May 18, 2015
White River Flooding near Kadoka, SD, May 18, 2015

Flooding on the White River near Kadoka, SD, streamgage 06447000. Streamflow at this site was measured by USGS as about 26,000 cubic feet per second on May 18, 2015. Major flooding on the White River in South Dakota occurred in May 2015 following snow and rain events in western South Dakota.

Flooding on the White River near Kadoka, SD, streamgage 06447000. Streamflow at this site was measured by USGS as about 26,000 cubic feet per second on May 18, 2015. Major flooding on the White River in South Dakota occurred in May 2015 following snow and rain events in western South Dakota.

Image: White River Flooding near Kadoka, SD
White River Flooding near Kadoka, SD

Flooding on the White River near Kadoka, SD, streamgage 06447000. The gage house is left of center near hay bales. Streamflow at this site was measured by USGS as about 26,000 cubic feet per second on May 18, 2015. Major flooding on the White River in South Dakota occurred in May 2015 following snow and rain events in western South Dakota.

Flooding on the White River near Kadoka, SD, streamgage 06447000. The gage house is left of center near hay bales. Streamflow at this site was measured by USGS as about 26,000 cubic feet per second on May 18, 2015. Major flooding on the White River in South Dakota occurred in May 2015 following snow and rain events in western South Dakota.

Image: Denver Streamflow Monitoring
Denver Streamflow Monitoring

Tony Trease, USGS Hydrologic Technician, measuring streamflow in the South Platte River outside of Denver, Colo.

Tony Trease, USGS Hydrologic Technician, measuring streamflow in the South Platte River outside of Denver, Colo.

Image: Denver Streamflow Monitoring
Denver Streamflow Monitoring

Tony Trease, USGS Hydrologic Technician, measuring streamflow in the South Platte River outside of Denver, Colo.

Tony Trease, USGS Hydrologic Technician, measuring streamflow in the South Platte River outside of Denver, Colo.

Image: Ben Jones Drills a Core
Ben Jones Drills a Core

USGS research geographer Ben Jones is dressed warmly as he stands next to portable core-drilling device in a snow-covered area.

USGS research geographer Ben Jones is dressed warmly as he stands next to portable core-drilling device in a snow-covered area.

Equipment for collecting a groundwater sample is spread on a table
Groundwater sample collection

Collecting a groundwater-quality sample from a public-supply well. This well is being sampled for water-quality constituents as part of the NAWQA Enhanced Trend Network project.

Collecting a groundwater-quality sample from a public-supply well. This well is being sampled for water-quality constituents as part of the NAWQA Enhanced Trend Network project.

USGS employee during a routine Acoustic Doppler Velocimeter measurement at USGS gage 2055100
USGS Employee During A Routine Measurement At USGS Gage 2055100, VA

USGS employee Keith Lambert during a routine Acoustic Doppler Velocimeter measurement at USGS gage 2055100 Tinker Creek near Daleville, VA.

Columbia River flows by highway in Portland, OR, with Mt. Hood in background
Columbia River in Portland, OR, with Mt. Hood
Screen capture of ModelMuse with the caption "The farm process also requires the modeler define the properties of the farms."
ModelMuse: Farm Process

Screen capture of ModelMuse with the caption "The farm process also requires the modeler define the properties of the farms."

Screen capture of ModelMuse with the caption "The farm process also requires the modeler define the properties of the farms."

USGS Scientist Adam Mumford WBS Sampling Under Ice
WBS Sampling Under Ice

Icy Sampling
RML scientist, Adam Mumford, working under ice to obtain grab samples of a stream in North Dakota to assess impacts of a brine spill from unconventional oil and gas activities (UOG). UOG spills often have very high concentrations of salts, metals, naturally occurring radioactive materials (NORMs), and organic compounds. 

Centrifuge Bowl Containing River Suspended Sediment
Centrifuge Bowl Containing River Suspended Sediment for Analysis

A U.S. Geological Survey hydrologist holds a centrifuge bowl containing river suspended sediment for analysis of metals and organic chemicals. The sample was collected using a new in-field continuous-flow centrifugation technique to separate and collect suspended sediment from large volumes of water.

A U.S. Geological Survey hydrologist holds a centrifuge bowl containing river suspended sediment for analysis of metals and organic chemicals. The sample was collected using a new in-field continuous-flow centrifugation technique to separate and collect suspended sediment from large volumes of water.

Public-supply well
A chain-link fence encloses a public-supply well.

A large-volume public supply well in San Antonio, Texas.  This well is being sampled for water-quality constituents as part of the NAWQA Enhanced Trend Network project.

A USGS streamgage
A USGS streamflow gaging station is used to collect water data

A U.S. Geological Survey streamflow gaging station collects water data on the Trask River. The Trask River gage is located near Tillamook, Ore. and has been in operation for 17 years.  

A U.S. Geological Survey streamflow gaging station collects water data on the Trask River. The Trask River gage is located near Tillamook, Ore. and has been in operation for 17 years.  

USGS streamgage in foreground with river and trees in background
USGS streamgage on the Trask River

Trask River stage, discharge, and water-quality data are collected and used together to help monitor the current health of the river. Data from the river are sent to equipment in the gage house, where it is stored then transmitted to USGS servers. 

Trask River stage, discharge, and water-quality data are collected and used together to help monitor the current health of the river. Data from the river are sent to equipment in the gage house, where it is stored then transmitted to USGS servers. 

USGS' Brian Selck samples a private well in Lycoming County, PA
Sampling a private well in Lycoming County, Pennsylvania

Brian Selck, a USGS National Association of Geoscience Teachers intern, collects a water level measurement from a domestic well at a site north of Jersey Shore in Lycoming County, Pennsylvania, June 2014.

Brian Selck, a USGS National Association of Geoscience Teachers intern, collects a water level measurement from a domestic well at a site north of Jersey Shore in Lycoming County, Pennsylvania, June 2014.

Little Plover River Wells

Both irrigation wells and municipal wells affect water levels in the Little Plover River, Wisconsin. 

Both irrigation wells and municipal wells affect water levels in the Little Plover River, Wisconsin. 

A public supply well in front of a large concrete structure that aerates the water
Public supply well and aerator

Anoxic groundwater pumped from the embayment-uplands aquifers for municipal supply is oxygenated as it cascades over aerator trays. The iron and manganese that are dissolved in the water precipitate and are filtered from the water.

Anoxic groundwater pumped from the embayment-uplands aquifers for municipal supply is oxygenated as it cascades over aerator trays. The iron and manganese that are dissolved in the water precipitate and are filtered from the water.

A 3D Elevation Program lidar point cloud showing simulated flooding (in blue) of an area in Denver, Colorado
3DEP, lidar point cloud, Denver

A 3D Elevation Program lidar point cloud showing simulated flooding (in blue) of an area in Denver, Colorado

Was this page helpful?