
From the northwest corner of the largest down-dropped block within Kīlauea caldera, HVO scientists were able to spot the southern edge of the lava lake that was recently active, from December 2020 to May 2021. The ongoing Kīlauea caldera gas survey is being conducted with permission from Hawai‘i Volcanoes National Park.
Images
Explore our planet through photography and imagery, including climate change and water all the way back to the 1800s when the USGS was surveying the country by horse and buggy.
Filter Total Items: 21338

Kīlauea caldera gas mapping—August 10, 2021
From the northwest corner of the largest down-dropped block within Kīlauea caldera, HVO scientists were able to spot the southern edge of the lava lake that was recently active, from December 2020 to May 2021. The ongoing Kīlauea caldera gas survey is being conducted with permission from Hawai‘i Volcanoes National Park.

Views of Halema‘uma‘u, at the summit of Kīlauea—August 10, 2021
Views of Halema‘uma‘u, at the summit of Kīlauea—August 10, 2021On Tuesday, August 10, HVO scientists traversed the west and south rims of Halema‘uma‘u, at the summit of Kīlauea, to collect photos of the inactive lava lake from many different angles. Such a collection of photos will enable the construction of a three-dimensional model of the crusted lake surface using structure-from-motion software.

Hoosick River near Williamstown, MA sculpture
Photo Contest Winner | August 2021 | Where We Work
Hoosick River near Williamstown, MA sculpture
Photo Contest Winner | August 2021 | Where We Work
Hoosick River near Williamstown, MA sculpture

Anchor system for a smart mooring and spotter buoy
Anchor system for a smart mooring and spotter buoyAn anchor station in 20m water depth with a wave buoy and smart mooring attached. This instrument will deliver high-fidelity, real-time wave, water level, and wind data to scientists at the USGS St. Petersburg Coastal and Marine Science Center.

August 6, 2021 — Kīlauea GPS campaign
In recent weeks, HVO geophysicists have been undertaking a Global Positioning System (GPS) campaign across Kīlauea.
In recent weeks, HVO geophysicists have been undertaking a Global Positioning System (GPS) campaign across Kīlauea.
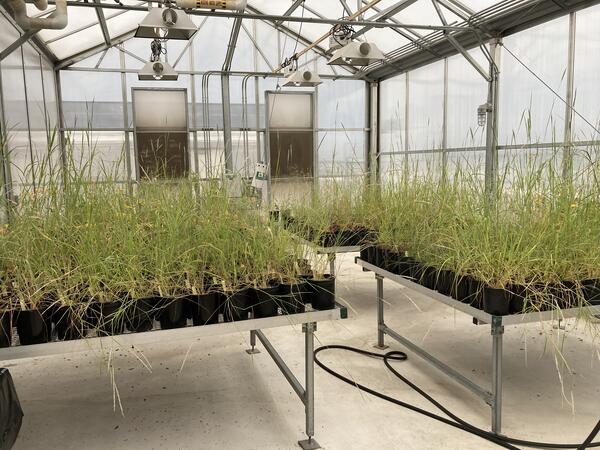
Greenhouse study comparing plant provenance for restoration
Greenhouse study comparing plant provenance for restorationRestoreNet is partnering with the Gornish lab at the University of Arizona to better understand how a plant’s source location (provenance) influences its performance in a restoration setting. This greenhouse experiment will be conducted by PhD student, Sierra Lauman.

Oceanographic buoy near the R/V Sallenger
A solar-powered Sofar spotter buoy floats in the water next to the R/V (Research Vessel) Sallenger.
A solar-powered Sofar spotter buoy floats in the water next to the R/V (Research Vessel) Sallenger.

R/V Sallenger and an oceanographic buoy
A solar-powered Sofar spotter buoy floats in the water next to the R/V (Research Vessel) Sallenger.
A solar-powered Sofar spotter buoy floats in the water next to the R/V (Research Vessel) Sallenger.

R/V Sallenger and an oceanographic buoy
A solar-powered Sofar spotter buoy floats in the water next to the R/V (Research Vessel) Sallenger.
A solar-powered Sofar spotter buoy floats in the water next to the R/V (Research Vessel) Sallenger.

Schematic showing collapse processes of Yellowstone Caldera
Schematic showing collapse processes of Yellowstone CalderaSchematic displaying the general processes associated with collapse of Yellowstone Caldera. (A) Pre-caldera volcanism includes the eruption of dome complexes from the underlying magma chambers. (B) The caldera-forming eruption evacuates a significant amount of magma from the chamber, causing the overlying crustal block to subside into the void space.&nbs

Scientific diver ascends after deploying oceanographic instruments
Scientific diver ascends after deploying oceanographic instrumentsA scientific diver ascends safely towards the surface after deploying a wave buoy and smart mooring in 20m water depth. This instrument will deliver high-fidelity, real-time wave, water level, and wind data to scientists at the USGS St. Petersburg Coastal and Marine Science Center.

Scientific diver at an anchor station for oceanographic buoy
Scientific diver at an anchor station for oceanographic buoyA scientific diver next to an anchor station in 20m water depth with a wave buoy and smart mooring attached. This instrument will deliver high-fidelity, real-time wave, water level, and wind data to scientists at the USGS St. Petersburg Coastal and Marine Science Center.

Geologists discuss the district-scale geology at Pogo Mine, Alaska
Geologists discuss the district-scale geology at Pogo Mine, AlaskaAlaska Science Center geologist Doug Kreiner and University of Alaska, Fairbanks professor Sean Regan discuss the district-scale geology with the chief exploration geologist at Pogo Mine. This is a new collaborative study with USGS, UAF and Pogo Mine, to collaborate on unraveling the genesis of Pogo, an important producer of gold in Alaska with critical mi

Three geologists looking at igneous textures in granitic rocks
Three geologists looking at igneous textures in granitic rocksAlaska Science Center geologist Doug Kreiner and University of Alaska, Fairbanks professor Sean Regan look at igneous textures in granitic rocks hosting gold at the Pogo gold mine with Pogo exploration geologists.

Novel Stereo CoastCam
A novel stereo CoastCam will be installed on at dune at Pea Island for the duration of the experiment.
A novel stereo CoastCam will be installed on at dune at Pea Island for the duration of the experiment.

Annual Kīlauea GPS Survey—2021
Over the past few months, HVO geophysicists have been conducting the annual high-precision Global Positioning System (GPS) survey of Kīlauea. The annual survey supplements HVO's continuous GPS monitoring stations and provides information on vertical and horizontal deformation of the ground surface.
Over the past few months, HVO geophysicists have been conducting the annual high-precision Global Positioning System (GPS) survey of Kīlauea. The annual survey supplements HVO's continuous GPS monitoring stations and provides information on vertical and horizontal deformation of the ground surface.

Kīlauea caldera gas mapping—August 3, 2021
HVO scientists continue their survey of Kīlauea caldera floor, including the down-dropped block, for diffuse volcanic gas emissions. This photo shows a large crack, on a portion of the caldera floor that subsided in 2018, that is emitting volcanic gas and steam.
HVO scientists continue their survey of Kīlauea caldera floor, including the down-dropped block, for diffuse volcanic gas emissions. This photo shows a large crack, on a portion of the caldera floor that subsided in 2018, that is emitting volcanic gas and steam.

Kīlauea caldera gas mapping—August 3, 2021
Stacked lava flows are visible in the wall of the down-dropped block, which was exposed during the Kīlauea summit collapse events in 2018. A small exposure of lighter-colored volcanic ash, likely the Keanakāko‘i tephra deposits erupted during Kīlauea's last explosive phase several hundred years ago, is visible beneath tens of meters (yards) of lava flows.
Stacked lava flows are visible in the wall of the down-dropped block, which was exposed during the Kīlauea summit collapse events in 2018. A small exposure of lighter-colored volcanic ash, likely the Keanakāko‘i tephra deposits erupted during Kīlauea's last explosive phase several hundred years ago, is visible beneath tens of meters (yards) of lava flows.

Close up view of inactive western fissure spatter cone in Halema‘uma‘u
Close up view of inactive western fissure spatter cone in Halema‘uma‘uEruptive activity paused within Halema‘uma‘u, at Kīlauea's summit, a bit more than 2 months ago. In that time, the spatter cone at the western fissure complex has slowly degraded due to numerous small scale collapses, leaving a debris apron (fresh looking rubble) and exposing the interior of the spatter cone. USGS photo by N. Deligne.

R/V Sallenger tows SQUID-5
The R/V Sallenger tows the SQUID-5 over Looe Key reef with a NOAA Sanctuary boat in the background patrolling the Looe Key area to warn recreational vessels of the ongoing research activity.
The R/V Sallenger tows the SQUID-5 over Looe Key reef with a NOAA Sanctuary boat in the background patrolling the Looe Key area to warn recreational vessels of the ongoing research activity.

View of Halema‘uma‘u at Kīlauea summit - July 30, 2021
View of Halema‘uma‘u at Kīlauea summit - July 30, 2021A view looking north into Halema‘uma‘u on July 30, 2021. Although eruptive activity has paused at the summit of Kīlauea, HVO geologists still monitor the lava lake and summit area weekly. Lava lake surface depths remain the same since mid to late May when active lava was last observed at the surface. USGS photo by N. Deligne.