Kalmunai, Sri Lanka, after the December 2004 tsunami
Kalmunai, Sri Lanka, after the December 2004 tsunamiPhoto taken about 100 meters inland at Kalmunai on Sri Lanka's east coast.


Official websites use .gov
A .gov website belongs to an official government organization in the United States.

Secure .gov websites use HTTPS
A lock () or https:// means you’ve safely connected to the .gov website. Share sensitive information only on official, secure websites.

Coastal and Marine Hazards and Resources Program images.

Photo taken about 100 meters inland at Kalmunai on Sri Lanka's east coast.
Photo taken about 100 meters inland at Kalmunai on Sri Lanka's east coast.

Tsunami sand deposit at Nilaveli Beach on the northeastern coast of Sri Lanka following the December 26th, 2004 earthquake and tsunami in the Indian Ocean. The sand deposited by the tsunami is light colored and overlies a pre-tsunami darker sandy soil.
Tsunami sand deposit at Nilaveli Beach on the northeastern coast of Sri Lanka following the December 26th, 2004 earthquake and tsunami in the Indian Ocean. The sand deposited by the tsunami is light colored and overlies a pre-tsunami darker sandy soil.
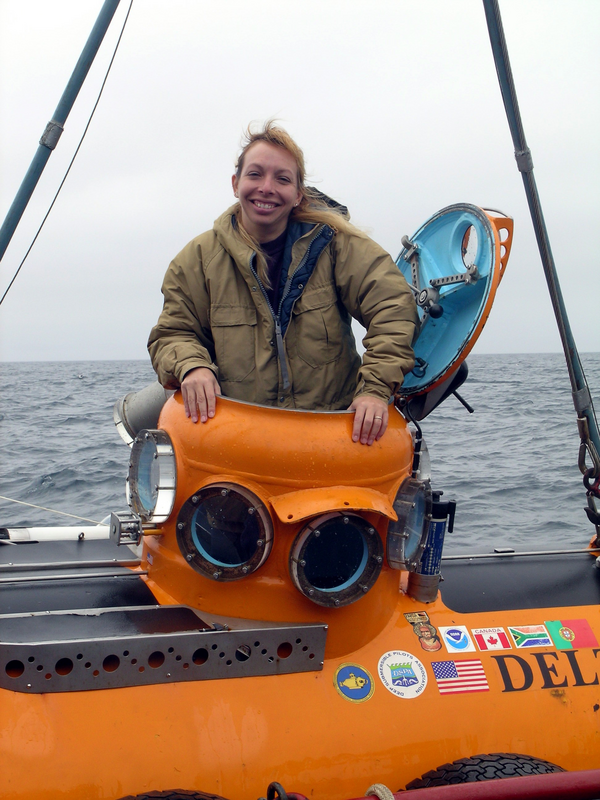
Dr. Christina Kellogg emerges from the submersible Delta after collecting coral samples in the Aleutian Islands in 2004.
Dr. Christina Kellogg emerges from the submersible Delta after collecting coral samples in the Aleutian Islands in 2004.

Large-scale poster describing USGS work.

Large-scale poster describing USGS work.
The USGS, in cooperation with Moss Landing Marine Laboratory, mapped the slopes of the Santa Barbara Channel using sonar. We combined this with deep sea drilling records and seismic records to make these maps.
Large-scale poster describing USGS work.
The USGS, in cooperation with Moss Landing Marine Laboratory, mapped the slopes of the Santa Barbara Channel using sonar. We combined this with deep sea drilling records and seismic records to make these maps.

Photograph of the Florida coastline shows storm damage after Hurricane Jeanne's passage.
Photograph of the Florida coastline shows storm damage after Hurricane Jeanne's passage.

The Weedon Island Preserve is a 3,190-acre coastal system in Tampa Bay, Florida that is comprised of aquatic and upland ecosystems.
The Weedon Island Preserve is a 3,190-acre coastal system in Tampa Bay, Florida that is comprised of aquatic and upland ecosystems.

Diagram of deep-seated landslide, from USGS Fact Sheet 3004–3072, “Landslide Types and Processes.”
Diagram of deep-seated landslide, from USGS Fact Sheet 3004–3072, “Landslide Types and Processes.”

Large-scale poster describing USGS work.
The USGS studied air photos of the Big Sur coast taken in 1942 and 1994, in cooperation with the California Department of Transportation (Caltrans) and the University of California at Santa Cruz (UCSC).
Large-scale poster describing USGS work.
The USGS studied air photos of the Big Sur coast taken in 1942 and 1994, in cooperation with the California Department of Transportation (Caltrans) and the University of California at Santa Cruz (UCSC).

Zoomed in aerial photograph of a home on the beach near Stuart, Florida, severely damaged by Hurricane Jeanne in September 2004.
Zoomed in aerial photograph of a home on the beach near Stuart, Florida, severely damaged by Hurricane Jeanne in September 2004.

Here are shown a series of photographs of a rice coral (Montipora capitata) shaded with light filters during a natural “coral bleaching” event observed during anomalously high ocean temperatures in Autumn of 2004 on the island of Oʻahu, Hawaiʻi.
Here are shown a series of photographs of a rice coral (Montipora capitata) shaded with light filters during a natural “coral bleaching” event observed during anomalously high ocean temperatures in Autumn of 2004 on the island of Oʻahu, Hawaiʻi.

The Great Barrier Reef arches over 2000 kilometers along the northeast coast of Australia. The white calcium carbonate that coats the coral reflects light, making the water above the reef appear bright blue from space.
The Great Barrier Reef arches over 2000 kilometers along the northeast coast of Australia. The white calcium carbonate that coats the coral reflects light, making the water above the reef appear bright blue from space.

Storage vans, referred to as the "Freezer Farm" sit outside the Woods Hole Science Center
Storage vans, referred to as the "Freezer Farm" sit outside the Woods Hole Science Center

Lab setup aboard R/V Gyre in the Gulf of America from the 2003 field season. Computers, recorders, and other electronic gear are securely mounted in racks or on tabletops and shelving for stability in rolling seas and for access.
Lab setup aboard R/V Gyre in the Gulf of America from the 2003 field season. Computers, recorders, and other electronic gear are securely mounted in racks or on tabletops and shelving for stability in rolling seas and for access.

Airborne lidar is a surveying method that measures distance to a target from a survey plane by illuminating that target with a pulsed laser light, and measuring the reflected pulses with a sensor. Differences in laser return times and wavelengths can then be used to make digital 3D-representations of the target.
Airborne lidar is a surveying method that measures distance to a target from a survey plane by illuminating that target with a pulsed laser light, and measuring the reflected pulses with a sensor. Differences in laser return times and wavelengths can then be used to make digital 3D-representations of the target.
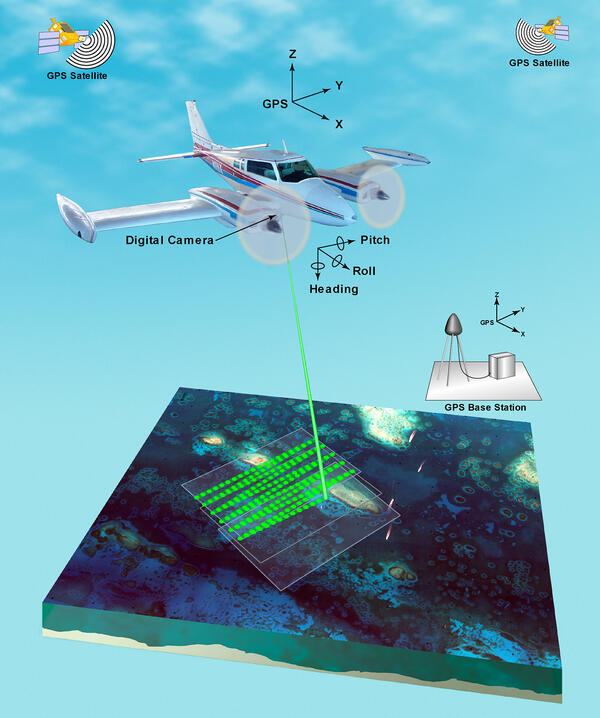
Airborne lidar is a surveying method that measures distance to a target from a survey plane by illuminating that target with a pulsed laser light, and measuring the reflected pulses with a sensor. Differences in laser return times and wavelengths can then be used to make digital 3D-representations of the target.
Airborne lidar is a surveying method that measures distance to a target from a survey plane by illuminating that target with a pulsed laser light, and measuring the reflected pulses with a sensor. Differences in laser return times and wavelengths can then be used to make digital 3D-representations of the target.

Swath bathymetric map of the Cape Fear submarine slide, the largest slide on the US Atlantic coast. Data were collected on the R/V Atlantis in 2003.
Swath bathymetric map of the Cape Fear submarine slide, the largest slide on the US Atlantic coast. Data were collected on the R/V Atlantis in 2003.

Large-scale poster describing USGS work.

Aerial photograph of Kaanapali Beach, west Maui, Hawaii.
Aerial photograph of Kaanapali Beach, west Maui, Hawaii.

Map showing the paths that ocean current-following surface drifters deployed in coral larval slicks off west Maui traveled in 24 hours following their release during a coral spawning event. Such data suggests that the coral reefs off west-central Maui may provide coral larvae to the reefs off northeastern Lānaʻi.
Map showing the paths that ocean current-following surface drifters deployed in coral larval slicks off west Maui traveled in 24 hours following their release during a coral spawning event. Such data suggests that the coral reefs off west-central Maui may provide coral larvae to the reefs off northeastern Lānaʻi.

Underwater photograph of larvae being released into the water column from reef-building coral spawning off Maui the night of June 30, 2003. The white larvae are about 0.5 to 1.5 mm across.
Underwater photograph of larvae being released into the water column from reef-building coral spawning off Maui the night of June 30, 2003. The white larvae are about 0.5 to 1.5 mm across.