
Scientists collect soil cores in coastal wetland by removing a section of peat, the organic-rich material that makes up salt marshes. After the soil is removed, water quickly fills in the void. This water-logged environment underground is devoid of oxygen and is an important reason that salt marsh peat preserves a record of historical changes.
Images
Coastal and Marine Hazards and Resources Program images.
Filter Total Items: 2413

Soil core from coastal wetland
Scientists collect soil cores in coastal wetland by removing a section of peat, the organic-rich material that makes up salt marshes. After the soil is removed, water quickly fills in the void. This water-logged environment underground is devoid of oxygen and is an important reason that salt marsh peat preserves a record of historical changes.
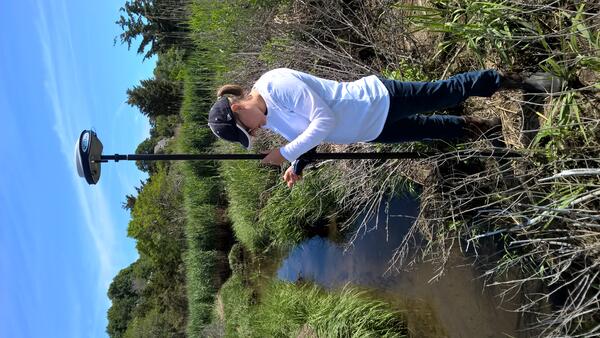
Meagan Eagle, USGS Research Scientist, collecting elevation points in Quivett Creek, Brewster, MA
Meagan Eagle, USGS Research Scientist, collecting elevation points in Quivett Creek, Brewster, MAMeagan Eagle, Research Scientists at the U.S. Geological Survey, collects an elevation point along the edge of Quivett Creek in Brewster, MA. This salt marsh was restored in 2005 by replacing a narrow culvert to allow full tidal flow once again.

Sam Johnson explains details of a fault zone
Sam Johnson explaining details of the Hosgri fault zone at USGS offices in Santa Cruz.
Sam Johnson explaining details of the Hosgri fault zone at USGS offices in Santa Cruz.

Sam Johnson explaining details of a fault zone
Geophysicist Sam Johnson explaining details of the San Andreas fault zone at USGS offices in Santa Cruz.
Geophysicist Sam Johnson explaining details of the San Andreas fault zone at USGS offices in Santa Cruz.

Bass Creek Salt Marsh, Yarmouth, MA
Salt marsh grass grows in the restored marsh at Bass Creek, Yarmouth, MA.
Salt marsh grass grows in the restored marsh at Bass Creek, Yarmouth, MA.

Bass Creek salt marsh, Yarmouth, MA
Two USGS scientists measure elevation at Bass Creek salt marsh, Yarmouth, MA.
Two USGS scientists measure elevation at Bass Creek salt marsh, Yarmouth, MA.

Piping Plover Nest
USGS scientists are working to model shorebird habitat availability both today and in the future, given processes like sea-level rise, in an effort to support the efficient management of beaches for both people and nesting shorebirds.
USGS scientists are working to model shorebird habitat availability both today and in the future, given processes like sea-level rise, in an effort to support the efficient management of beaches for both people and nesting shorebirds.

R/V Solstice
Alaska Department of Fish and Games vessel Solstice carried USGS scientists for three weeks in May 2015 while they mapped 650 square kilometers of seafloor and features beneath the seafloor in fine detail.
Alaska Department of Fish and Games vessel Solstice carried USGS scientists for three weeks in May 2015 while they mapped 650 square kilometers of seafloor and features beneath the seafloor in fine detail.

Colored Shaded-Relief Bathymetry of San Francisco
This colored shaded-relief bathymetry map of the Offshore of San Francisco map area in northern California was generated from bathymetry data collected by California State University, Monterey Bay (CSUMB) and by Fugro Pelagos (fig. 1).
This colored shaded-relief bathymetry map of the Offshore of San Francisco map area in northern California was generated from bathymetry data collected by California State University, Monterey Bay (CSUMB) and by Fugro Pelagos (fig. 1).

Alaska DFG vessel Solstice
Mapping along the Queen Charlotte-Fairweather fault required several days aboard the Alaska Department of Fish and Game research vessel Solstice. Here, the boat sits in a marina near Cordova, Alaska.
Mapping along the Queen Charlotte-Fairweather fault required several days aboard the Alaska Department of Fish and Game research vessel Solstice. Here, the boat sits in a marina near Cordova, Alaska.

Coral reefs, Kwajalein Atoll, Republic of the Marshall Islands
Coral reefs, Kwajalein Atoll, Republic of the Marshall IslandsAerial photograph of Kwajalein Atoll showing its low-lying islands and coral reefs.
Coral reefs, Kwajalein Atoll, Republic of the Marshall Islands
Coral reefs, Kwajalein Atoll, Republic of the Marshall IslandsAerial photograph of Kwajalein Atoll showing its low-lying islands and coral reefs.

Coral reefs, Kwajalein Atoll, Republic of the Marshall Islands
Coral reefs, Kwajalein Atoll, Republic of the Marshall IslandsAerial photograph of Kwajalein Atoll showing its low-lying islands and coral reefs.
Coral reefs, Kwajalein Atoll, Republic of the Marshall Islands
Coral reefs, Kwajalein Atoll, Republic of the Marshall IslandsAerial photograph of Kwajalein Atoll showing its low-lying islands and coral reefs.

Coral reefs, Kwajalein Atoll, Republic of the Marshall Islands
Coral reefs, Kwajalein Atoll, Republic of the Marshall IslandsAerial photograph of Kwajalein Atoll showing its low-lying islands and coral reefs.
Coral reefs, Kwajalein Atoll, Republic of the Marshall Islands
Coral reefs, Kwajalein Atoll, Republic of the Marshall IslandsAerial photograph of Kwajalein Atoll showing its low-lying islands and coral reefs.

Coral reefs, Kwajalein Atoll, Republic of the Marshall Islands
Coral reefs, Kwajalein Atoll, Republic of the Marshall IslandsAerial photograph of Kwajalein Atoll showing its low-lying islands and coral reefs.
Coral reefs, Kwajalein Atoll, Republic of the Marshall Islands
Coral reefs, Kwajalein Atoll, Republic of the Marshall IslandsAerial photograph of Kwajalein Atoll showing its low-lying islands and coral reefs.

Coral reefs, Kwajalein Atoll, Republic of the Marshall Islands
Coral reefs, Kwajalein Atoll, Republic of the Marshall IslandsUnderwater image of a wave breaking over a coral reef on Kwajalein Atoll in the Republic of the Marshall Islands. This image shows how the high hydrodynamic roughness of live, healthy corals causes friction that induces breaking of waves over coral reefs, reducing wave energy at the shoreline that can cause flooding and island overwash.

Coral reefs, Kwajalein Atoll, Republic of the Marshall Islands
Coral reefs, Kwajalein Atoll, Republic of the Marshall IslandsAerial photograph of Kwajalein Atoll showing its low-lying islands and coral reefs.
Coral reefs, Kwajalein Atoll, Republic of the Marshall Islands
Coral reefs, Kwajalein Atoll, Republic of the Marshall IslandsAerial photograph of Kwajalein Atoll showing its low-lying islands and coral reefs.

Coral reefs, Kwajalein Atoll, Republic of the Marshall Islands
Coral reefs, Kwajalein Atoll, Republic of the Marshall IslandsAerial photograph of Kwajalein Atoll showing its low-lying islands and coral reefs.
Coral reefs, Kwajalein Atoll, Republic of the Marshall Islands
Coral reefs, Kwajalein Atoll, Republic of the Marshall IslandsAerial photograph of Kwajalein Atoll showing its low-lying islands and coral reefs.

Four airgun arrays towed behind R/V Marcus G. Langseth.
Four airgun arrays towed behind R/V Marcus G. Langseth.Four airgun arrays towed behind R/V Marcus G. Langseth.
Four airgun arrays towed behind R/V Marcus G. Langseth.
Four airgun arrays towed behind R/V Marcus G. Langseth.Four airgun arrays towed behind R/V Marcus G. Langseth.

Beach elevation profile data collection on Fire Island, New York.
Beach elevation profile data collection on Fire Island, New York.A USGS researcher collects beach elevation profile data on Fire Island, New York.
Beach elevation profile data collection on Fire Island, New York.
Beach elevation profile data collection on Fire Island, New York.A USGS researcher collects beach elevation profile data on Fire Island, New York.

Barnegat Bay residence times in days
Barnegat Bay residence times in days for (a) scenario T, only tidal forcing; (b) scenario TB, combined offshore hydrodynamic forcing; (c) scenario TBR, streamflow with combined hydrodynamic forcing; and (d) scenario TBRM, full suite with meteorological forcing
Barnegat Bay residence times in days for (a) scenario T, only tidal forcing; (b) scenario TB, combined offshore hydrodynamic forcing; (c) scenario TBR, streamflow with combined hydrodynamic forcing; and (d) scenario TBRM, full suite with meteorological forcing

Deploying the 8-km long streamer from R/V Marcus G. Langseth.
Deploying the 8-km long streamer from R/V Marcus G. Langseth.Deploying the 8-km long streamer from R/V Marcus G. Langseth.
Deploying the 8-km long streamer from R/V Marcus G. Langseth.
Deploying the 8-km long streamer from R/V Marcus G. Langseth.Deploying the 8-km long streamer from R/V Marcus G. Langseth.