
U.S. Geological Survey and National Park Service personnel stand with drone technologies used for mapping the Abó Ruins at Salinas Pueblo Missions National Monument in Mountainair, New Mexico.
Images
The National Land Imaging Program supports a variety of geospatial data programs and projects, including the USGS Landsat Program. Browse the images below to see some of the imagery produced using NLI-supported data sources.
Filter Total Items: 501
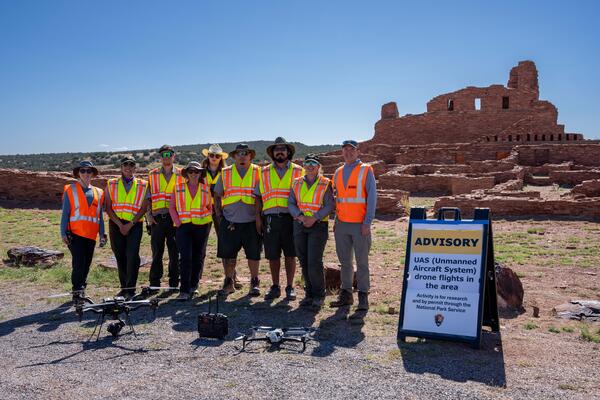
Mapping the Abó Ruins
U.S. Geological Survey and National Park Service personnel stand with drone technologies used for mapping the Abó Ruins at Salinas Pueblo Missions National Monument in Mountainair, New Mexico.

The BigMAC Exercise Site
This picture is the site of the Big Multi-Agency Campaign (BigMAC), a comprehensive field exercise aimed at assessing current technologies that might be used for validation of surface products derived from satellite imagery, The exercise was held in Brookings, South Dakota in August 2021.
This picture is the site of the Big Multi-Agency Campaign (BigMAC), a comprehensive field exercise aimed at assessing current technologies that might be used for validation of surface products derived from satellite imagery, The exercise was held in Brookings, South Dakota in August 2021.
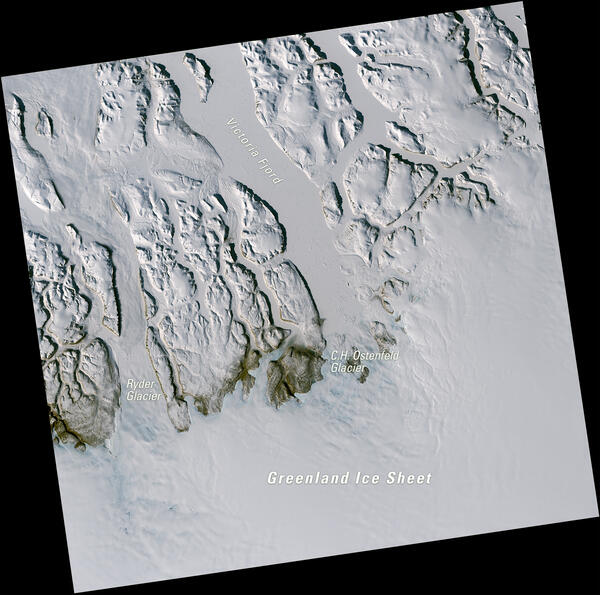
Landsat View of Glaciers and Fjords in Northern Greenland
Landsat View of Glaciers and Fjords in Northern GreenlandThis Landsat 8 image of northern Greenland, acquired May 10, 2025, uses the natural color combination of red, green, and blue spectral bands (bands 4,3,2). Snow and ice appear bright white and exposed rock appears brown. The scene features the Ryder Glacier, C.H. Ostenfeld Glacier, and Victoria Fjord, along with part of the Greenland Ice Sheet.
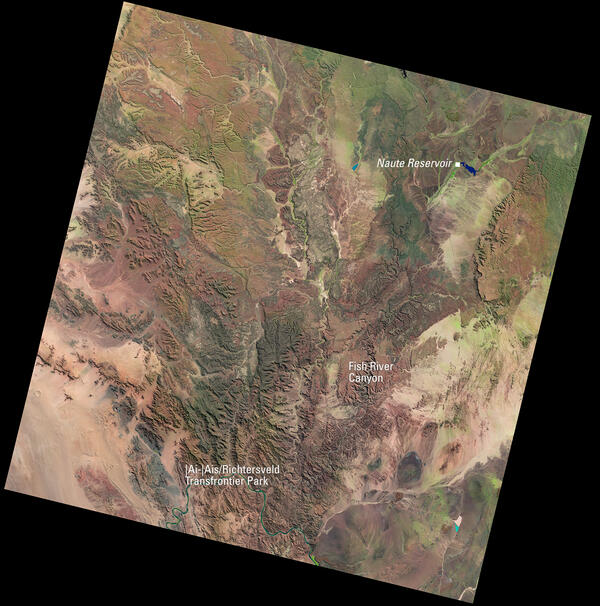
Landsat View of Namibia’s Fish River Canyon and ǀAi-ǀAis / Richtersveld Transfrontier Park
Landsat View of Namibia’s Fish River Canyon and ǀAi-ǀAis / Richtersveld Transfrontier ParkThis Landsat 8 image of southern Namibia, acquired May 7, 2025, uses the shortwave infrared, near infrared, and red spectral bands (bands 6,5,4) to highlight land cover. In this combination, healthy vegetation appears bright green, while bare ground and desert landscapes show in shades of brown and tan.
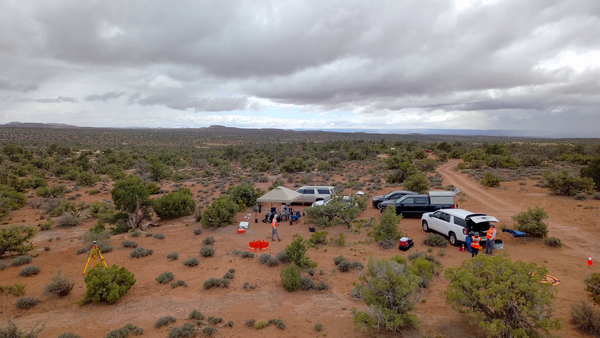
Uncrewed Aircraft Systems fieldwork site in Moab, Utah
Uncrewed Aircraft Systems fieldwork site in Moab, UtahDrone operations near Moab, Utah to collect spectral remote sensing imagery during a collaborative USGS field campaign in May 2025.
Uncrewed Aircraft Systems fieldwork site in Moab, Utah
Uncrewed Aircraft Systems fieldwork site in Moab, UtahDrone operations near Moab, Utah to collect spectral remote sensing imagery during a collaborative USGS field campaign in May 2025.

Landsat's View of the USA image
How does your state use Landsat satellite data? Visit the Landsat’s View of the USA webpage to find how Landsat benefits each of United States. You can download a satellite image, put together an online puzzle, or read a USGS Fact Sheet for your selected state!
How does your state use Landsat satellite data? Visit the Landsat’s View of the USA webpage to find how Landsat benefits each of United States. You can download a satellite image, put together an online puzzle, or read a USGS Fact Sheet for your selected state!

Landsat image displays recent flooding in the Lake Eyre Basin
Landsat image displays recent flooding in the Lake Eyre BasinIn April 2025, significant flooding occurred in an area of the Lake Eyre Basin in Southern Australia and Queensland states in Australia.
The Landsat 8 and Landsat 9 satellites both passed over the area and captured the dramatic imagery used in this mosaic of the area.

Flooding at the Cullyamurra Waterhole April 2025
In April 2025, the Cullyamurra Waterhole, along the Cooper River in South Australia, reached a water level of 13.39 meters. This surpassed the 1974 record of 11.85 meters.
In April 2025, the Cullyamurra Waterhole, along the Cooper River in South Australia, reached a water level of 13.39 meters. This surpassed the 1974 record of 11.85 meters.

Lake St. Clair
Lake St. Clair is a freshwater lake that lies between the State of Michigan and Ontario, Canada. Sometimes it is referred to as “the sixth Great Lake". Lake St. Clair is smaller and shallower than the Great Lakes with a surface area of only 430 square miles and an average depth of 11 feet.
Lake St. Clair is a freshwater lake that lies between the State of Michigan and Ontario, Canada. Sometimes it is referred to as “the sixth Great Lake". Lake St. Clair is smaller and shallower than the Great Lakes with a surface area of only 430 square miles and an average depth of 11 feet.

JACIE 2025 Attendees
The JACIE 2025 Workshop in-person attendees are shown in this picture. The Workshop was held April 7-11, 2025.
The JACIE 2025 Workshop in-person attendees are shown in this picture. The Workshop was held April 7-11, 2025.

EarthNow! Viewer
The EarthNow! Landsat Image Viewer displays imagery in near real-time as Landsat satellites orbit the Earth. Along with the near real-time video stream, EarthNow! also replays acquisition recordings from previous Landsat overpasses. When Landsat satellites are out of viewing range of a ground station, the most recent overpass is displayed.
The EarthNow! Landsat Image Viewer displays imagery in near real-time as Landsat satellites orbit the Earth. Along with the near real-time video stream, EarthNow! also replays acquisition recordings from previous Landsat overpasses. When Landsat satellites are out of viewing range of a ground station, the most recent overpass is displayed.

March 2025 Before Flooding in the US
This Landsat 8 image shows an area of the east central portion of the United States on March 22, 2025. The muted hues of tan pocked with some green areas indicate vegetation awakening from winter dormancy, and the reservoirs and waterways are well within their banks.
This Landsat 8 image shows an area of the east central portion of the United States on March 22, 2025. The muted hues of tan pocked with some green areas indicate vegetation awakening from winter dormancy, and the reservoirs and waterways are well within their banks.

April 2025 Flooding in the US
Powerful storms containing heavy rains caused major flooding to areas in the east central portion of the United States in early April 2025. Some communities in Kentucky saw more than 15 inches of rain, according to the National Weather Service.
Powerful storms containing heavy rains caused major flooding to areas in the east central portion of the United States in early April 2025. Some communities in Kentucky saw more than 15 inches of rain, according to the National Weather Service.
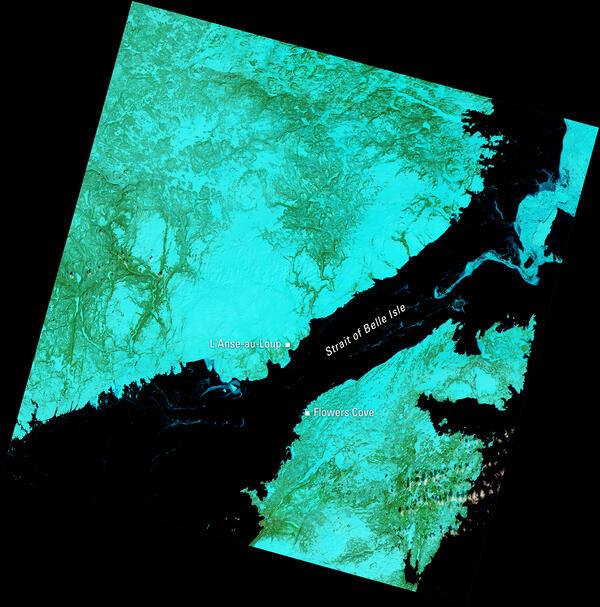
Landsat View of the Strait of Belle Isle, Canada
This Landsat 9 image of the Strait of Belle Isle, acquired April 8, 2025, uses the shortwave infrared, near infrared, and red spectral bands (bands 6,5,4) to highlight land cover. In this combination, healthy vegetation appears bright green, snow and ice appear in shades of cyan and blue, and water appears dark.
This Landsat 9 image of the Strait of Belle Isle, acquired April 8, 2025, uses the shortwave infrared, near infrared, and red spectral bands (bands 6,5,4) to highlight land cover. In this combination, healthy vegetation appears bright green, snow and ice appear in shades of cyan and blue, and water appears dark.
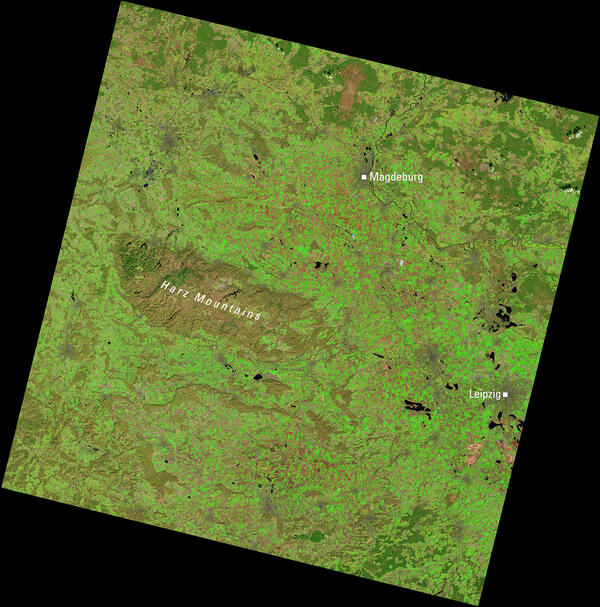
Landsat View of Central Germany and the Harz Mountains
Landsat View of Central Germany and the Harz MountainsThis Landsat 9 image highlights central Germany, including the Harz Mountains to the west and the cities of Magdeburg and Leipzig. The scene uses a shortwave infrared, near-infrared, and red band combination (Bands 6, 5, 4), which enhances vegetation in bright green and helps distinguish urban areas and water features.
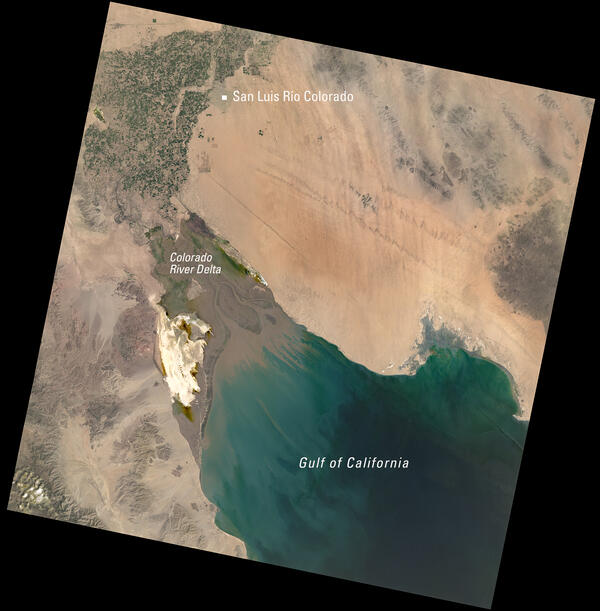
Landsat View of the Colorado River Delta and Gulf of California
Landsat View of the Colorado River Delta and Gulf of CaliforniaThis Landsat 9 image of northwestern Mexico, acquired March 30, 2025, uses the natural color combination of red, green, and blue spectral bands (bands 4,3,2). The scene highlights the Colorado River Delta, where desert meets irrigated farmland near San Luis Río Colorado, before flowing into the blue-green waters of the Gulf of California.

Tongariro National Park’s Volcanic Massif
This Landsat 8 image displays the massif of the three active volcanoes that dominate Tongariro National Park, on New Zealand’s North Island.
This Landsat 8 image displays the massif of the three active volcanoes that dominate Tongariro National Park, on New Zealand’s North Island.

Landsat Mosaic of Fort Peck Lake, Montana
Fort Peck Lake, a sprawling reservoir formed by the Fort Peck Dam on the Missouri River, lies in the eastern prairie region of Montana near the city of Glasgow. According to the U.S.
Fort Peck Lake, a sprawling reservoir formed by the Fort Peck Dam on the Missouri River, lies in the eastern prairie region of Montana near the city of Glasgow. According to the U.S.

Natural Color Landsat 8 Image of Mount Etna
Mount Etna is Europe’s largest and most active volcano. Located on the eastern coast of Sicily, Italy, in the province of Catania, the active stratovolcano is known for its frequent and persistent eruptions. Activity can range from explosive eruptions to lava flows and ash emissions.
Mount Etna is Europe’s largest and most active volcano. Located on the eastern coast of Sicily, Italy, in the province of Catania, the active stratovolcano is known for its frequent and persistent eruptions. Activity can range from explosive eruptions to lava flows and ash emissions.

Spatial Resolution Digital Imagery Guideline
This Spatial Resolution Digital Imagery Guideline was developed by Innovative and Imaging Research (I2R) for the USGS. This guide demonstrates how certain image specification parameters affect spatial resolution.
This Spatial Resolution Digital Imagery Guideline was developed by Innovative and Imaging Research (I2R) for the USGS. This guide demonstrates how certain image specification parameters affect spatial resolution.

Landsat Level-3 Dynamic Surface Water Extent of the Chesapeake Bay
Landsat Level-3 Dynamic Surface Water Extent of the Chesapeake BayThe Chesapeake Bay is roughly 200 miles (322 kilometers) in length and varies in width from a mere 4 miles (6.4 kilometers) near Aberdeen, Maryland, to 30 miles (48 kilometers) near Cape Charles, Virginia.