
This graphic displays the cumulative volume of all operational Landsat products downloaded from the USGS EROS Landsat archive since December 2008 (FY2009). The release of Landsat Collection 2 products in 2020, which improved data quality and accessibility, helped drive downloads upward.
Images
The National Land Imaging Program supports a variety of geospatial data programs and projects, including the USGS Landsat Program. Browse the images below to see some of the imagery produced using NLI-supported data sources.
Filter Total Items: 508
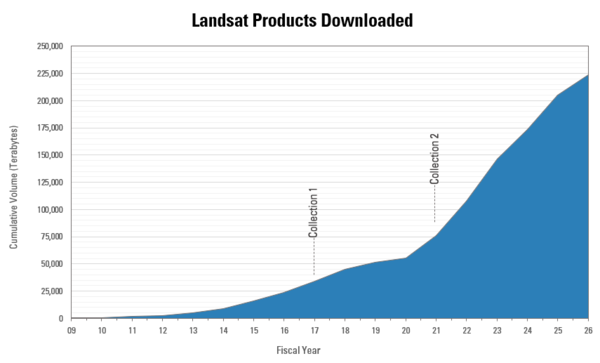
Landsat Product Downloads by Volume
This graphic displays the cumulative volume of all operational Landsat products downloaded from the USGS EROS Landsat archive since December 2008 (FY2009). The release of Landsat Collection 2 products in 2020, which improved data quality and accessibility, helped drive downloads upward.
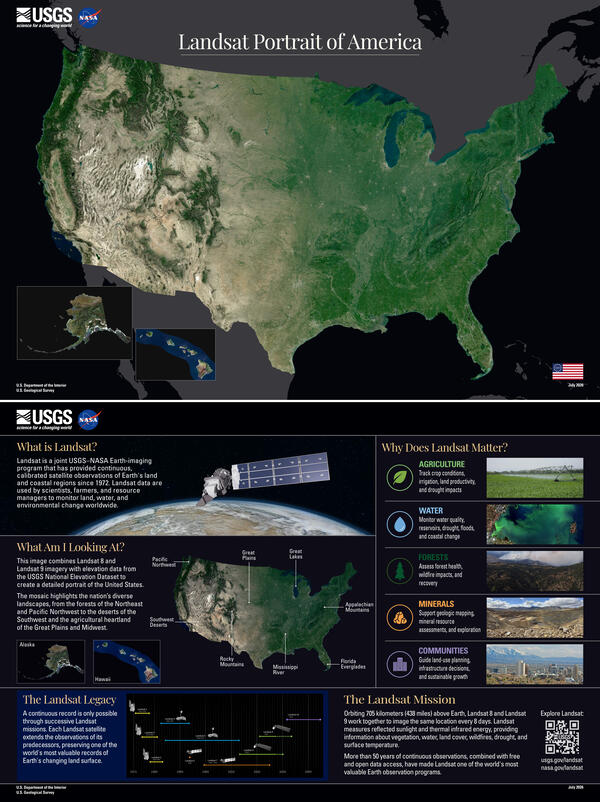
Landsat Portrait of America
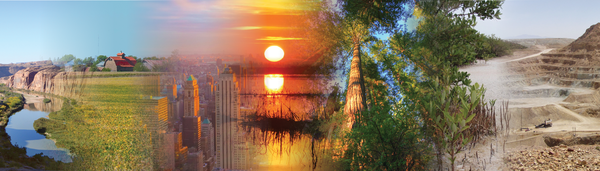
The complete Landsat Portrait of America poster, shown with the front on top and the back below.
The complete Landsat Portrait of America poster, shown with the front on top and the back below.
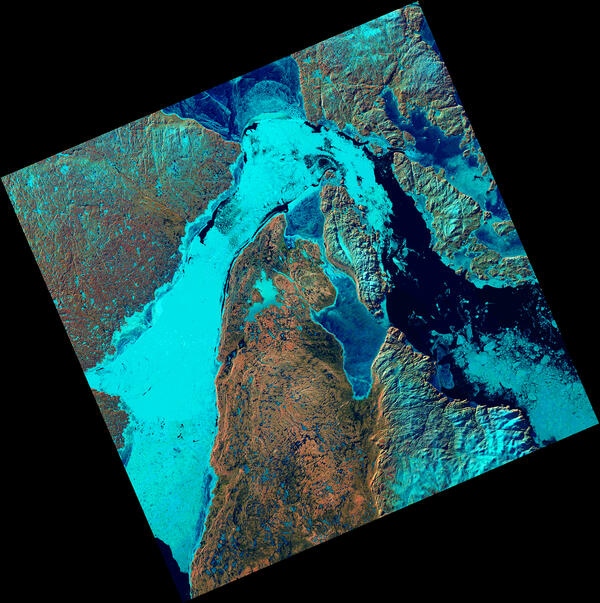
Ice Fills Roes Welcome Sound
The Landsat 8 satellite captured an image showing sea ice packed into Roes Welcome Sound, located along the northwestern edge of Southampton Island and around Qikiqtaaluk Island in the uninhabited Canadian Arctic Archipelago. East of Qikiqtaaluk, ice drifts through the Frozen Strait, extending eastward into Foxe Basin.
The Landsat 8 satellite captured an image showing sea ice packed into Roes Welcome Sound, located along the northwestern edge of Southampton Island and around Qikiqtaaluk Island in the uninhabited Canadian Arctic Archipelago. East of Qikiqtaaluk, ice drifts through the Frozen Strait, extending eastward into Foxe Basin.
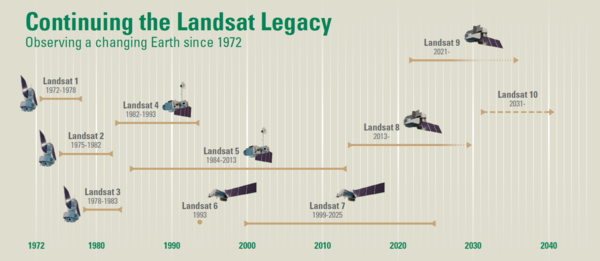
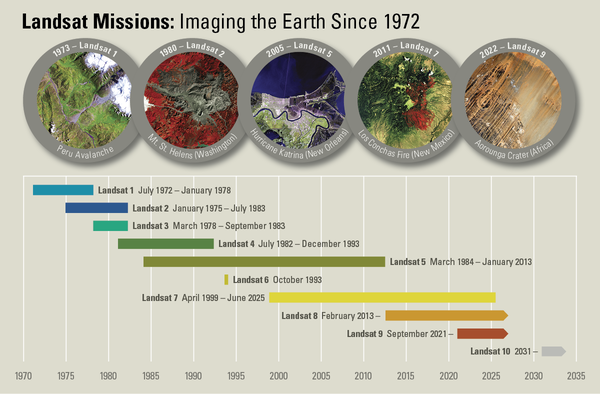
Continuing the Landsat Legacy
Timeline of the Landsat program, beginning with the launch of Landsat 1 in 1972. Landsat 10 is expected to launch in 2031. As the tenth Landsat mission, it will continue the legacy of the Landsat program.
Visit the Landsat Missions webpage to learn more.
Timeline of the Landsat program, beginning with the launch of Landsat 1 in 1972. Landsat 10 is expected to launch in 2031. As the tenth Landsat mission, it will continue the legacy of the Landsat program.
Visit the Landsat Missions webpage to learn more.
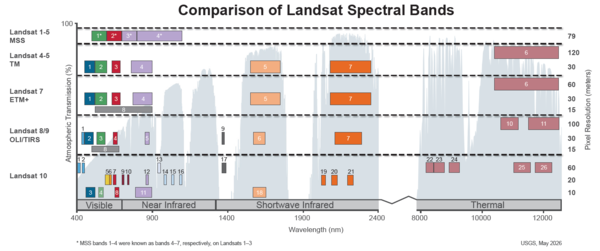
Spectral Bandpasses for all Landsat Sensors
This image shows the spectral bandpasses for the sensors on all Landsat satellites.
This image shows the spectral bandpasses for the sensors on all Landsat satellites.
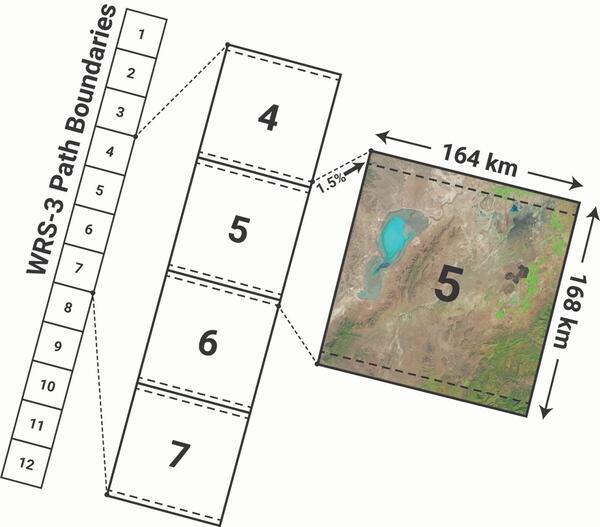
Worldwide Reference System-3 (WRS-3)
A new Worldwide Reference System, WRS-3, was developed for Landsat 10 due to the change in orbital parameters. The WRS-3 will provide a method to acquire, index, and catalog Landsat 10 scenes.
A new Worldwide Reference System, WRS-3, was developed for Landsat 10 due to the change in orbital parameters. The WRS-3 will provide a method to acquire, index, and catalog Landsat 10 scenes.
Landsat Missions Timeline
In a September 21, 1966 press release, Secretary of the Interior Stewart Udall announced that the DOI was launching "Project EROS (Earth Resources Observation Satellites)." Udall's vision was to observe the Earth for the benefit of all.
In a September 21, 1966 press release, Secretary of the Interior Stewart Udall announced that the DOI was launching "Project EROS (Earth Resources Observation Satellites)." Udall's vision was to observe the Earth for the benefit of all.

2026-2030 Landsat Science Team
The 2026-2030 Landsat Science Team met for their first in-person meeting May 5-7, 2026 at the USGS EROS Center.
The 2026-2030 Landsat Science Team met for their first in-person meeting May 5-7, 2026 at the USGS EROS Center.
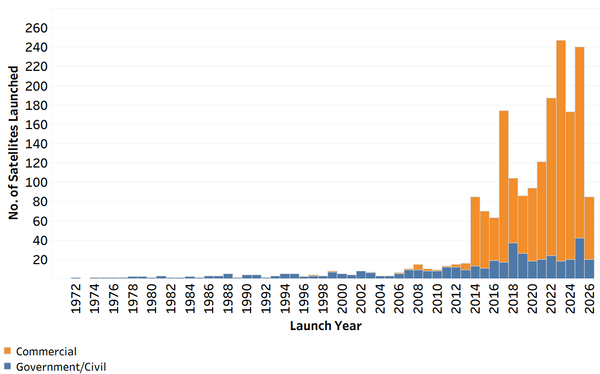
Number of Commercial, Government-Civil Earth Observing Satellites Launched
Number of Commercial, Government-Civil Earth Observing Satellites LaunchedThis chart shows the number of commercial and government/civil Earth observing satellites launched each year since 1972. This information is updated quarterly.
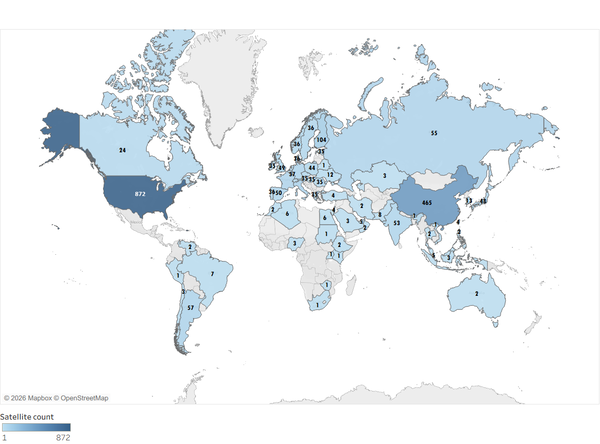
Countries with Earth Observing Satellites
The numbers on this map indicate the number of commercial and government/civil Earth observing satellites launched by the highlighted countries. This image is updated quarterly.
The numbers on this map indicate the number of commercial and government/civil Earth observing satellites launched by the highlighted countries. This image is updated quarterly.
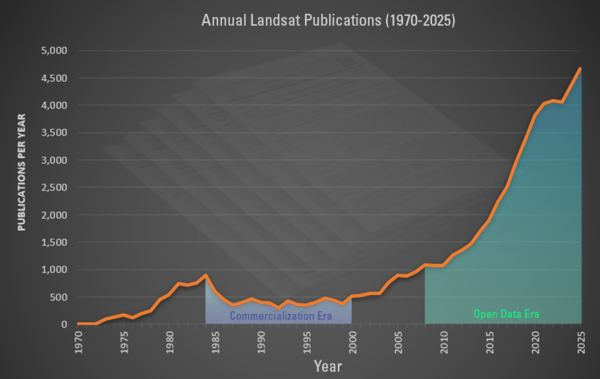
Landsat Citations
This graphic displays the number of Landsat-related publications starting in 1970. While publications decreased during the Commercialization Era, research rebounded greatly after the USGS open data policy decision in 2008.
This graphic displays the number of Landsat-related publications starting in 1970. While publications decreased during the Commercialization Era, research rebounded greatly after the USGS open data policy decision in 2008.
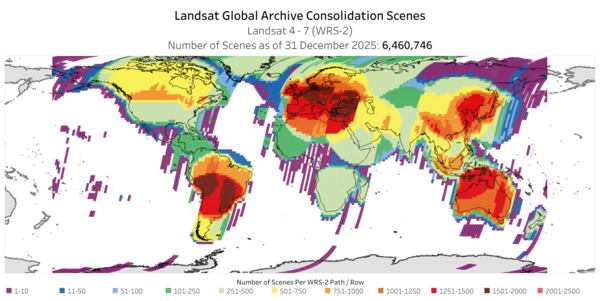
Landsat Global Archive Consolidation WRS 2 Scenes
This map displays the scenes acquired by Landsat 4, Landsat 5, and Landsat 7 satellites, on the World Reference System (WRS-2). These scenes were initially downlinked and stored at Landsat International Cooperator Ground Stations.
This map displays the scenes acquired by Landsat 4, Landsat 5, and Landsat 7 satellites, on the World Reference System (WRS-2). These scenes were initially downlinked and stored at Landsat International Cooperator Ground Stations.
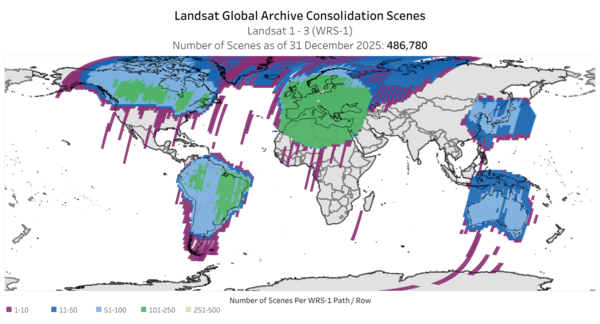
Landsat Global Archive Consolidation WRS 1 Scenes
This map displays the scenes acquired by Landsat 1, Landsat 2, and Landsat 3 satellites, on the World Reference System (WRS-1). These scenes were initially downlinked and stored at Landsat International Cooperator Ground Stations.
This map displays the scenes acquired by Landsat 1, Landsat 2, and Landsat 3 satellites, on the World Reference System (WRS-1). These scenes were initially downlinked and stored at Landsat International Cooperator Ground Stations.
Landsat Benefits Webpage Banner
The Landsat Benefits Webpage Banner displays some ways of how Landsat data benefits the United States.
Visit the Landsat Benefits, State by State webpage to see how Landsat benefits your favorite State!
The Landsat Benefits Webpage Banner displays some ways of how Landsat data benefits the United States.
Visit the Landsat Benefits, State by State webpage to see how Landsat benefits your favorite State!
Landsat 4 Mission Infographic
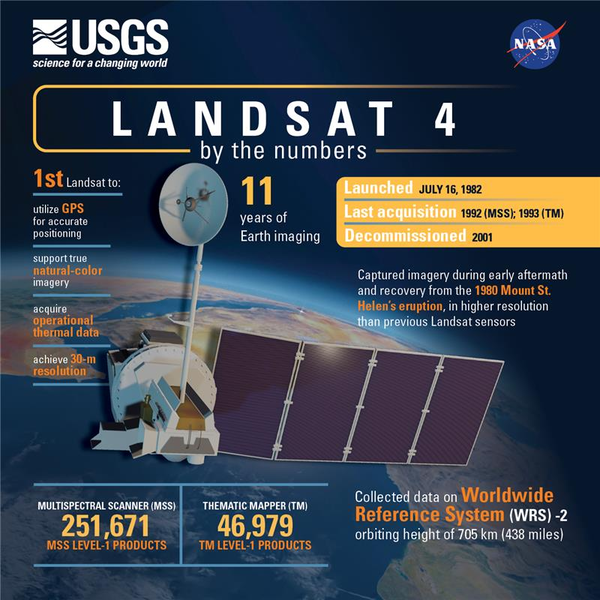
The Landsat 4 satellite was launched July 16, 1982, and ushered in many “firsts” that propelled the Landsat missions that followed.
The Landsat 4 satellite was launched July 16, 1982, and ushered in many “firsts” that propelled the Landsat missions that followed.
Las Vegas, 2025
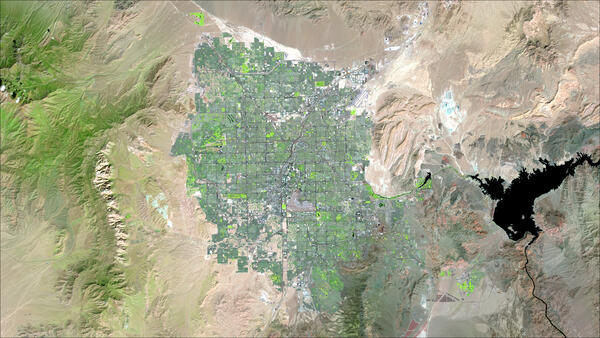
This false-color Landsat 8 image, acquired on September 16, 2025, shows the Las Vegas metropolitan area in southern Nevada. Lake Mead is visible east of the city, while the surrounding Mojave Desert, mountain ranges, and irrigated agricultural areas provide contrast with the urban landscape.
This false-color Landsat 8 image, acquired on September 16, 2025, shows the Las Vegas metropolitan area in southern Nevada. Lake Mead is visible east of the city, while the surrounding Mojave Desert, mountain ranges, and irrigated agricultural areas provide contrast with the urban landscape.

JACIE 2026 Workshop Save the Date
JACIE 2026 Workshop Save the Date
Visit the JACIE 2026 Workshop webpage to keep up with information about the April 2026 meeting.
JACIE 2026 Workshop Save the Date
Visit the JACIE 2026 Workshop webpage to keep up with information about the April 2026 meeting.
Landsat 9 False Color Image of the Beaufort Sea Shoreline
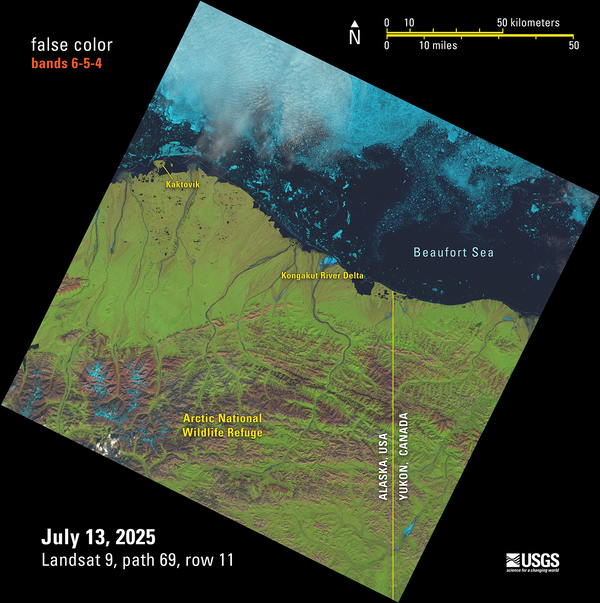
Landsat 9 False Color Image of the Beaufort Sea ShorelineThis Landsat 9 image showing the Beaufort Sea shoreline off of Alaska and Canada is just one of the scenes captured and processed on July 13, 2025— that day, the USGS EROS archive reached a milestone of one million Landsat 9 Level-1 products. This false color image was made with bands 6,5, and 4 from the Operational Land Imager.
Landsat 9 False Color Image of the Beaufort Sea Shoreline
Landsat 9 False Color Image of the Beaufort Sea ShorelineThis Landsat 9 image showing the Beaufort Sea shoreline off of Alaska and Canada is just one of the scenes captured and processed on July 13, 2025— that day, the USGS EROS archive reached a milestone of one million Landsat 9 Level-1 products. This false color image was made with bands 6,5, and 4 from the Operational Land Imager.
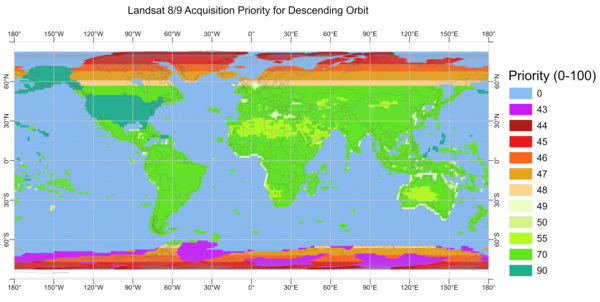
Landsat 8-9 Descending Acquisition Priority Map
This map displays the geographic coverage of descending (daytime) image acquisition priorities for Landsat 8 and Landsat 9 on a typical day. The priority scale denotes 0 (low priority) to 100 (high priority).
This map displays the geographic coverage of descending (daytime) image acquisition priorities for Landsat 8 and Landsat 9 on a typical day. The priority scale denotes 0 (low priority) to 100 (high priority).
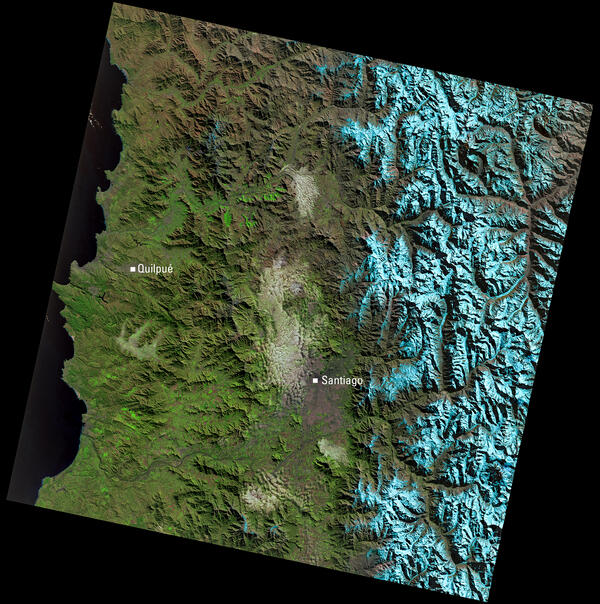
Landsat View of Central Chile and the Andes Mountains
Landsat View of Central Chile and the Andes MountainsThis Landsat 9 image of central Chile, acquired July 10, 2025, uses the shortwave infrared, near infrared, and red spectral bands ( bands 6,5,4) to highlight land cover. In this combination, healthy vegetation appears bright green, while snow and ice in the Andes Mountains show in bright blue.
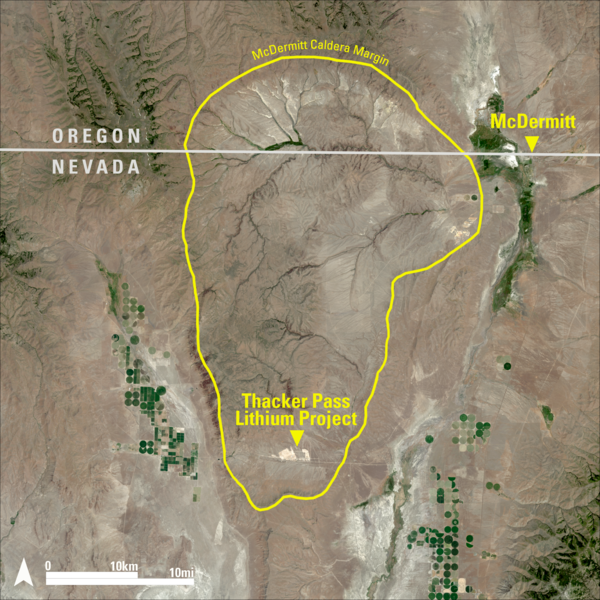
Landsat 8 Image of Thacker Pass
This Landsat 8 image highlights the McDermitt Caldera, which straddles the Nevada–Oregon border. The yellow boundary outlines the caldera margin, a geologic feature formed by a massive volcanic eruption millions of years ago. Over time, weathering of lithium-rich volcanic material led to the formation of clay deposits within the caldera basin.
This Landsat 8 image highlights the McDermitt Caldera, which straddles the Nevada–Oregon border. The yellow boundary outlines the caldera margin, a geologic feature formed by a massive volcanic eruption millions of years ago. Over time, weathering of lithium-rich volcanic material led to the formation of clay deposits within the caldera basin.