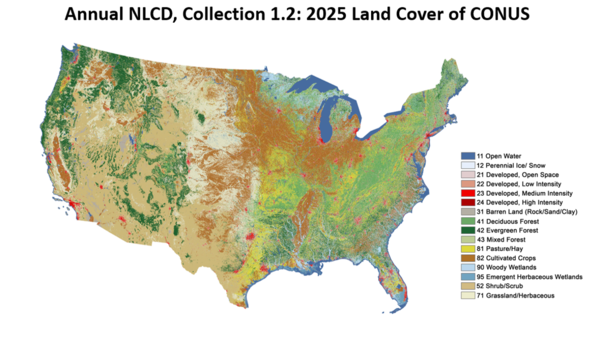
Annual National Land Cover Database (NLCD) Collection 1.2 map
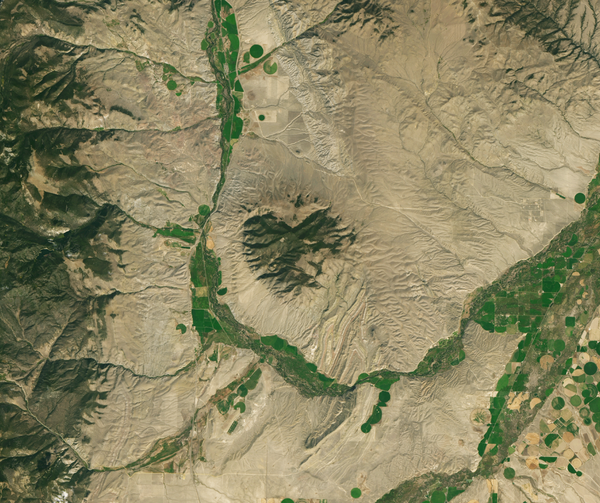
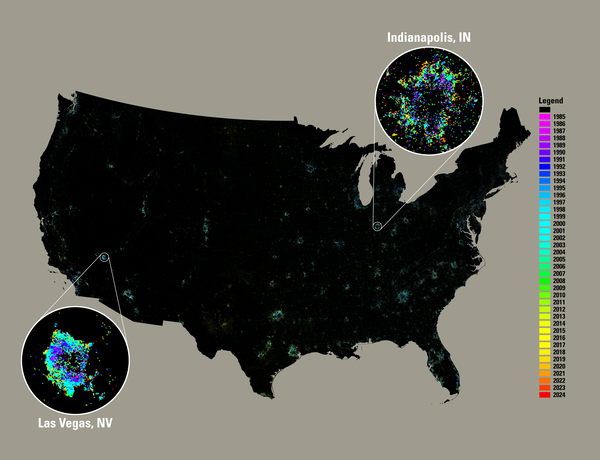
Annual National Land Cover Database (NLCD) Collection 1.2 mapAnnual National Land Cover Database (NLCD) Collection 1.2 map of 2025 data, produced at USGS Earth Resources Observation and Science (EROS) Center based on Landsat satellite data.